Rguroo
Creating a Dataset
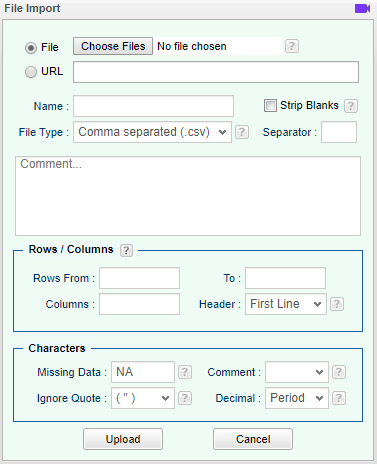
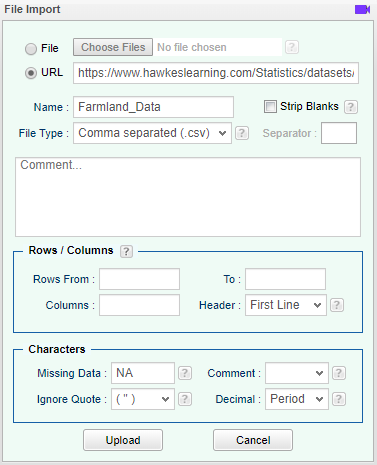
Import a File
-
Open the Data toolbox on the left-hand side of the Rguroo window. Use the Data Import dropdown menu and choose the Import Dataset option.
-
Choose a file or enter a URL. Adjust the other options appropriately.
-
Select Upload.
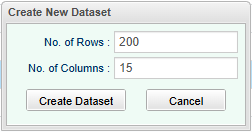
Create New Dataset
-
Open the Data toolbox on the left-hand side of the Rguroo window. Use the Data Import dropdown menu and choose the Create New Dataset option.
-
Enter your desired number of rows and columns. Select Create Dataset
-
Add data and variable names. Give your new dataset a name and select Save As….
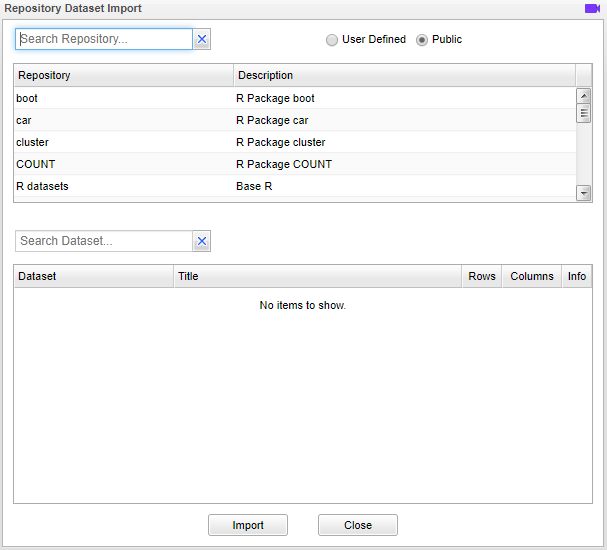
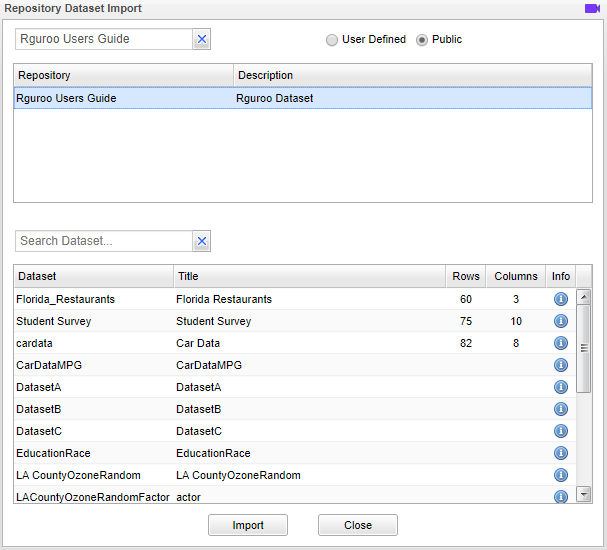
Importing Data from Rguroo's Data Repository
-
Open the Data toolbox on the left-hand side of the Rguroo window. Use the Data Import dropdown menu and choose the Dataset Repository option.
-
If you know the name of the repository you are looking for, enter the name of the repository in the Search Repository… field.
-
Select your desired repository. A list of all datasets within the selected repository will appear in the lower panel.
-
Highlight your desired dataset and select Import.
ANOVA
Fisher's LSD
-
See Creating a Dataset to input your data or recreate the example below by Accessing the Rguroo Data Repository and using the 'PlantGrowthX' dataset found in the 'Rguroo Users Guide' repository.
-
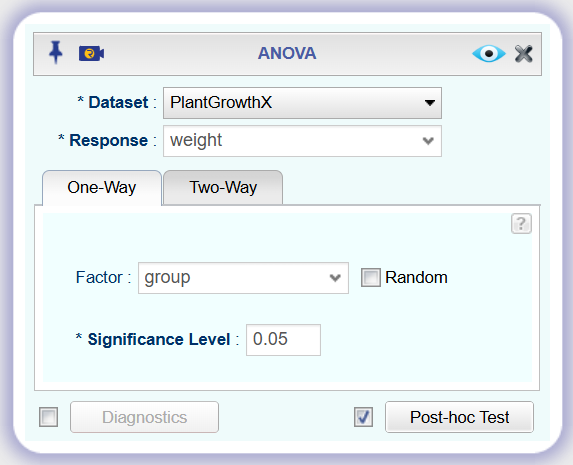
Open the Analytics toolbox on the left-hand side of the Rguroo window. Use the Analysis dropdown menu and choose the ANOVA option.
-
Select a Dataset and Response variable.
-
Under the one-way tab select a Factor variable and set a Significance Level.
-
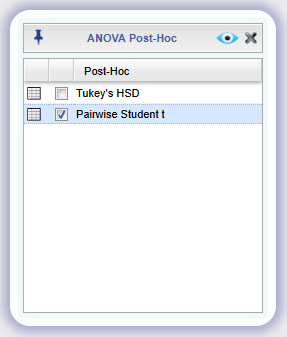
Check Post-hoc Test checkbox, click the Post-hoc Test button, and check Pairwise Student t.
-
Click the preview icon
 to see the result.
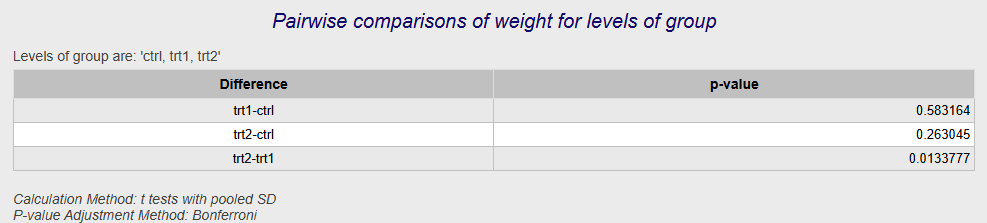
One-Way
-
See Creating a Dataset to input your data or recreate the example below by Accessing the Rguroo Data Repository and using the 'PlantGrowthX' dataset found in the 'Rguroo Users Guide' repository.
-
Open the Analytics toolbox on the left-hand side of the Rguroo window. Use the Analysis dropdown menu and choose the ANOVA option.
-
Select a Dataset and Response variable.
-
Under the one-way tab select a Factor variable and set a Significance Level.
-
Click the preview icon
to see the result.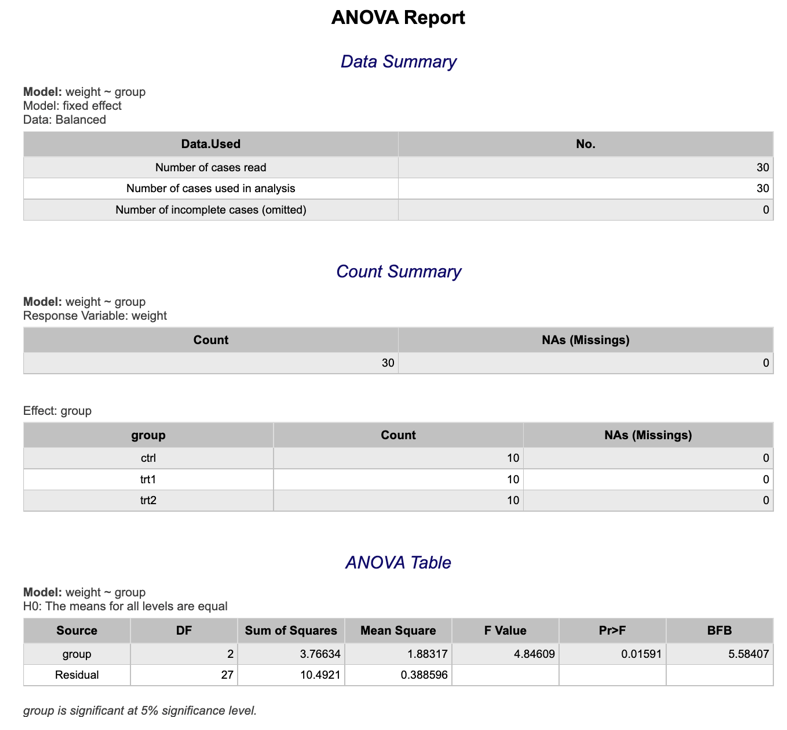
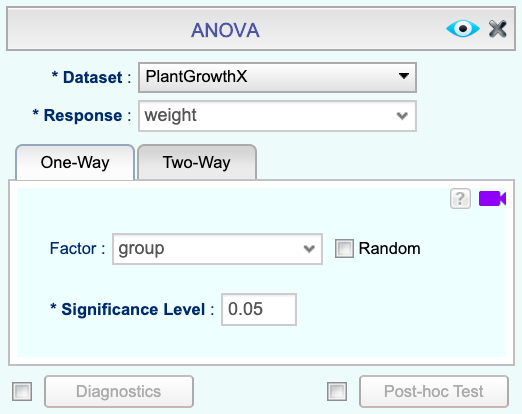
Tukey's HSD
-
See Creating a Dataset to input your data or recreate the example below by Accessing the Rguroo Data Repository and using the 'PlantGrowthX' dataset found in the 'Rguroo Users Guide' repository.
-
Open the Analytics toolbox on the left-hand side of the Rguroo window. Use the Analysis dropdown menu and choose the ANOVA option.
-
Select a Dataset and Response variable.
-
Under the one-way tab select a Factor variable and set a Significance Level.
-
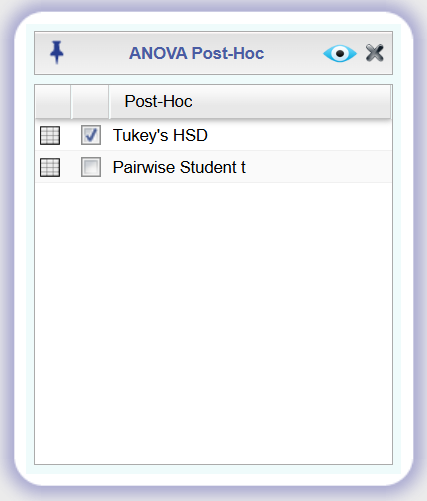
Check Post-hoc Test checkbox, click the Post-hoc Test button, and check Tukey's HSD.
-
Click the preview icon
to see the result.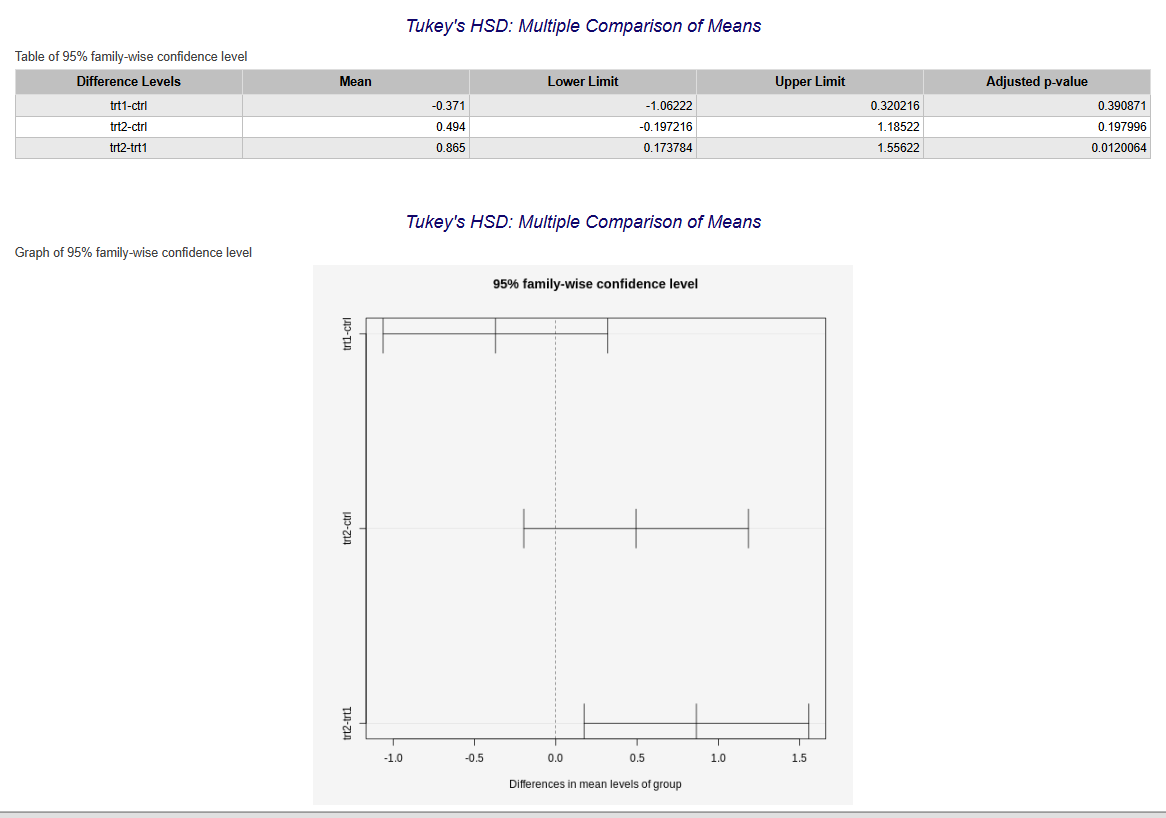
Two-Way
The Randomized Block Design
-
See Creating a Dataset to input your data or recreate the example below by Accessing the Rguroo Data Repository and using the 'PlantGrowthX' dataset found in the 'Rguroo Users Guide' repository.
-
Open the Analytics toolbox on the left-hand side of the Rguroo window. Use the Analysis dropdown menu and choose the ANOVA option.
-
Select a Dataset and Response variable.
-
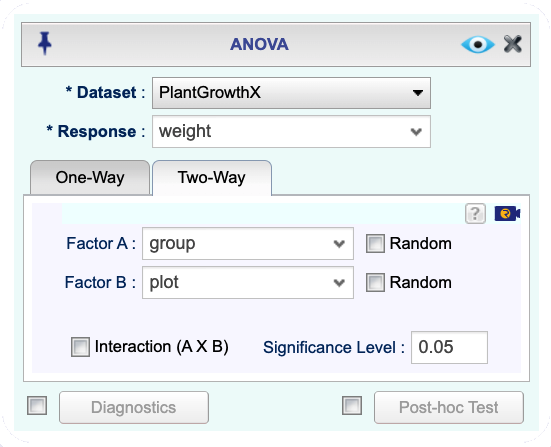
Click the Two-Way tab. Select Factor A and Factor B variables and set a Significance Level.
-
Click the preview icon
to see the result.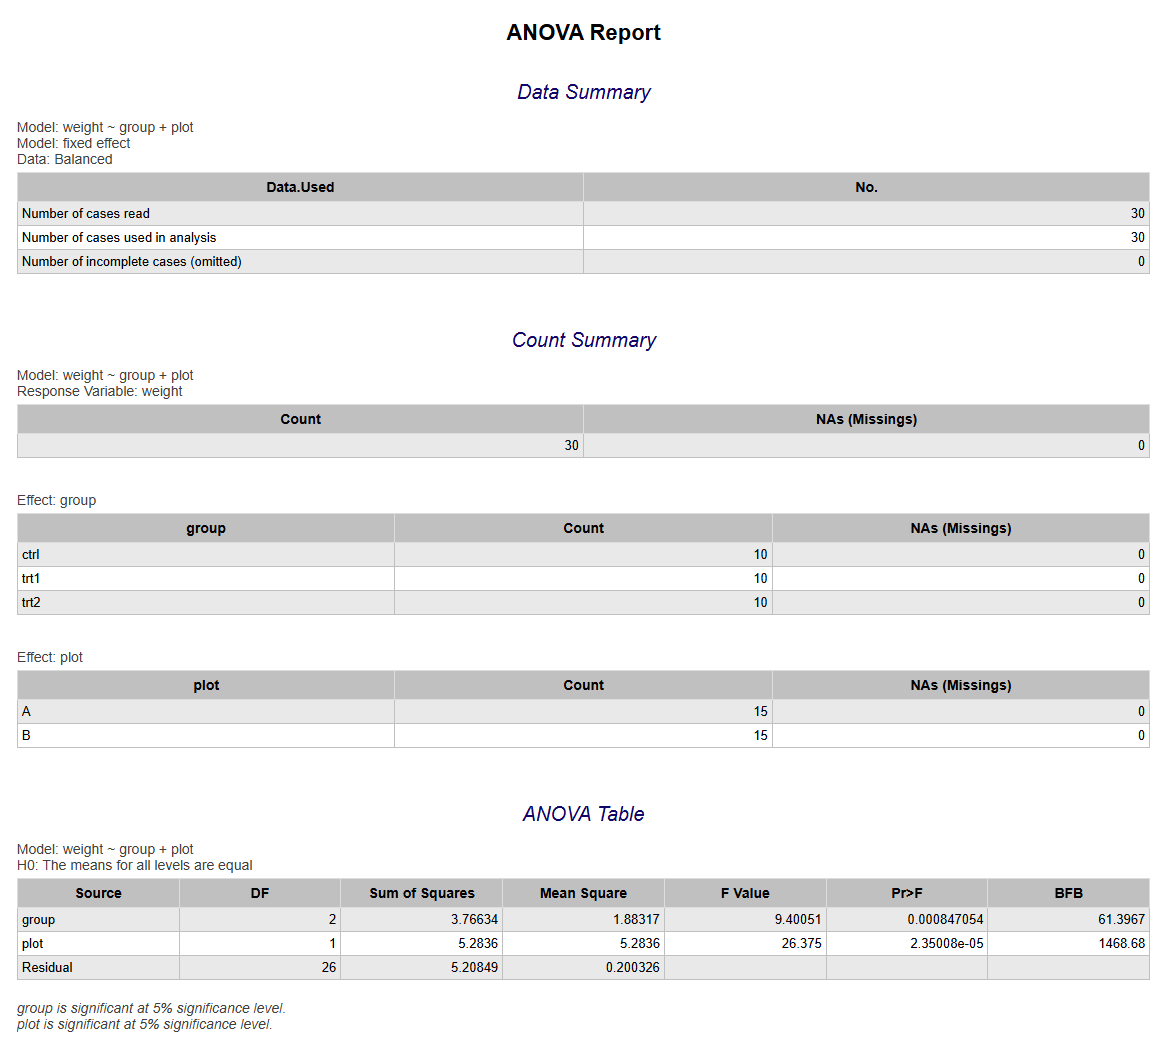
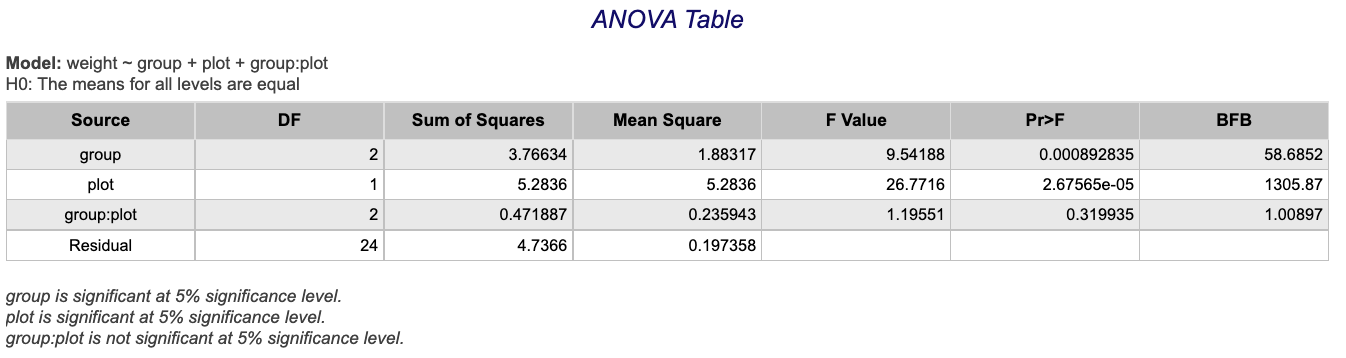
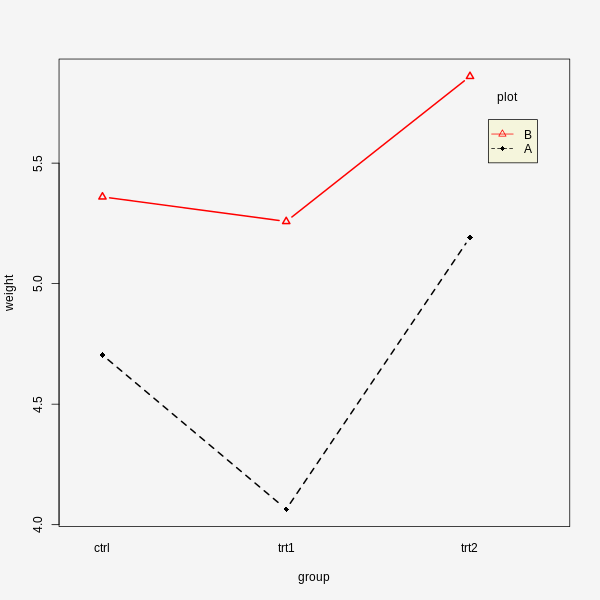
The Factorial Design
-
See Creating a Dataset to input your data or recreate the example below by Accessing the Rguroo Data Repository and using the 'PlantGrowthX' dataset found in the 'Rguroo Users Guide' repository.
-
Open the Analytics toolbox on the left-hand side of the Rguroo window. Use the Analysis dropdown menu and choose the ANOVA option.
-
Select a Dataset and Response variable.
-
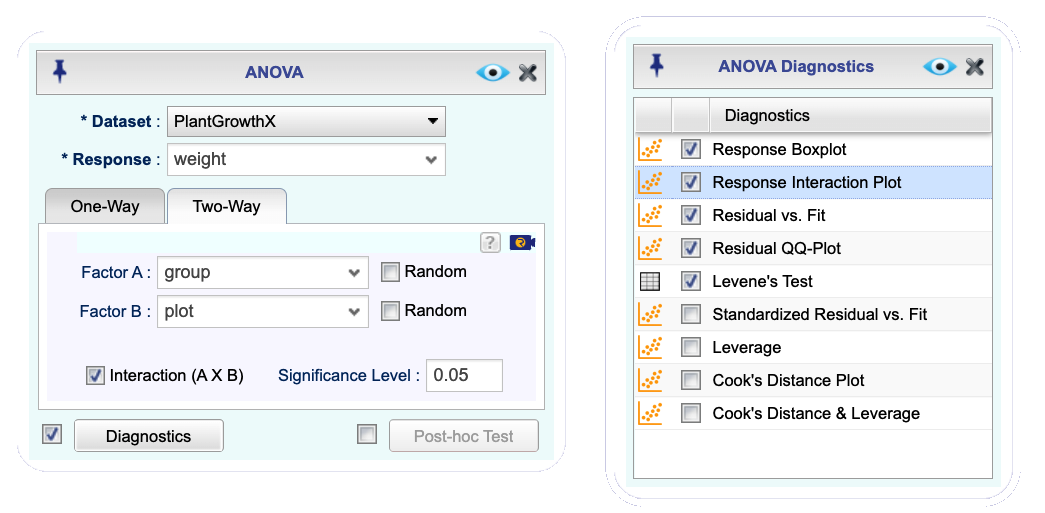
Click the Two-Way tab and select Factor A and Factor B. Check the Interaction (A X B) checkbox and set a Significance Level.
-
Check the checkbox next to the Diagnostics button. Click the Diagnostics button. In the ANOVA Diagnostics dialog that opens select Response Interaction Plot and other desired diagnostics.
-
Click the preview icon
to see the result.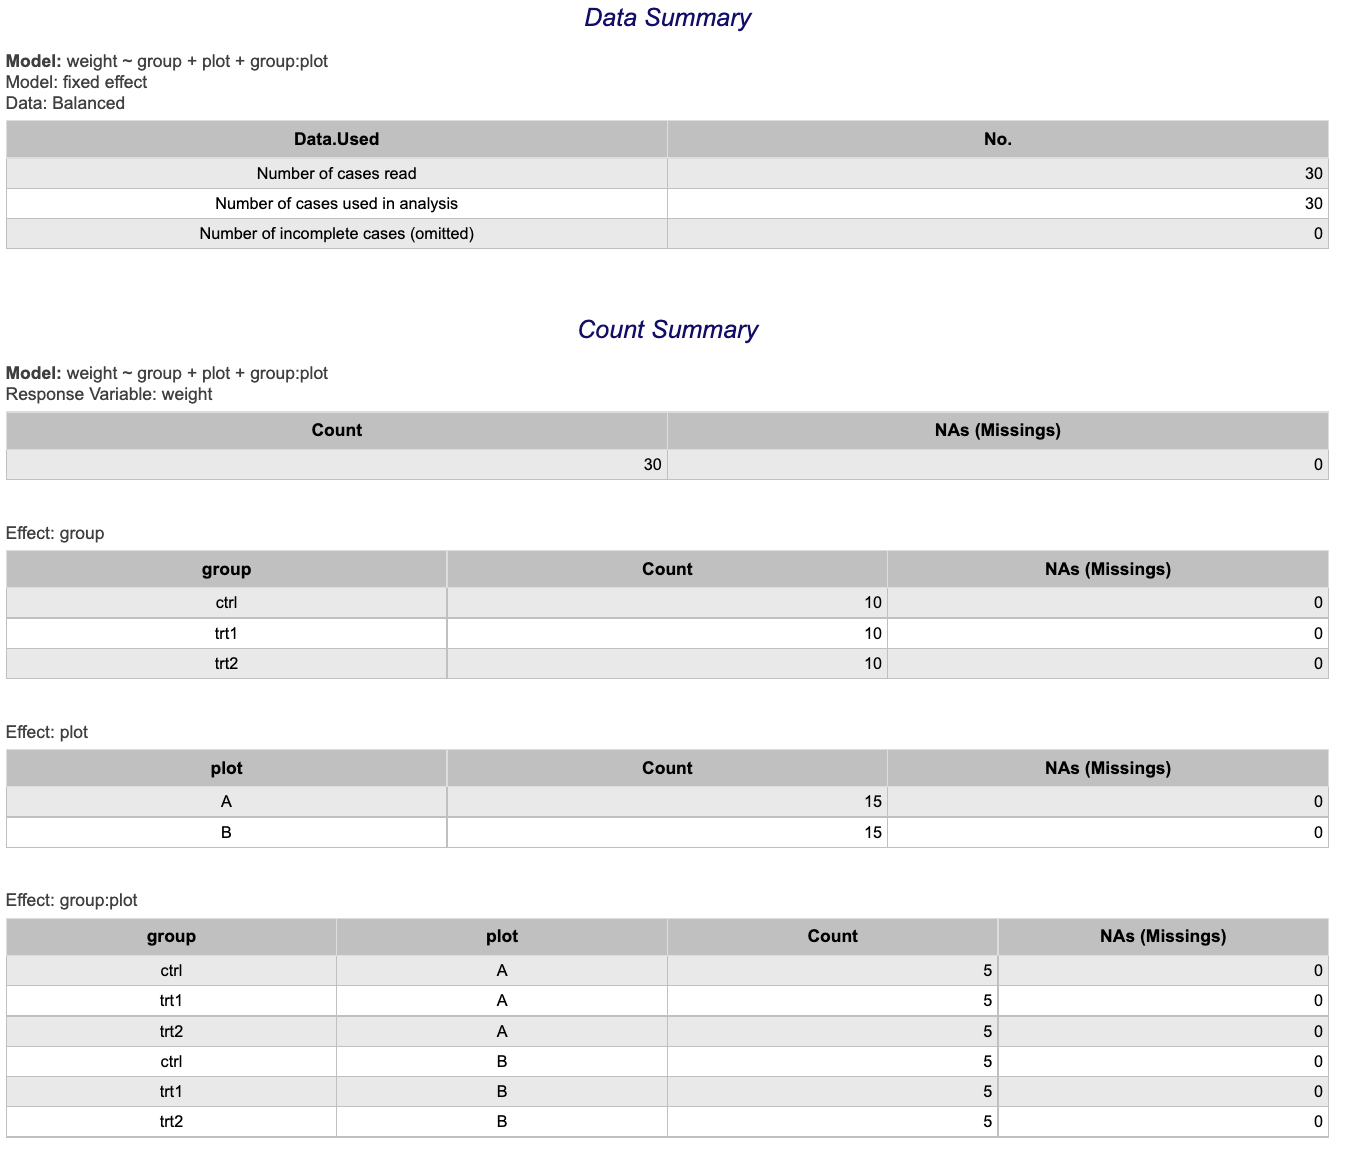
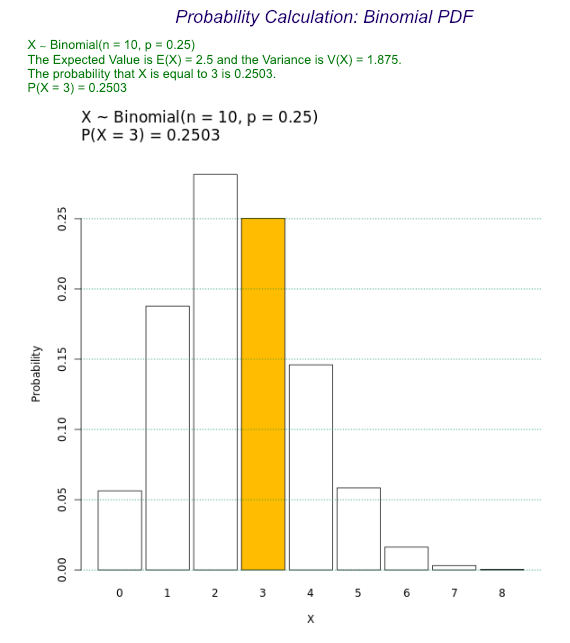
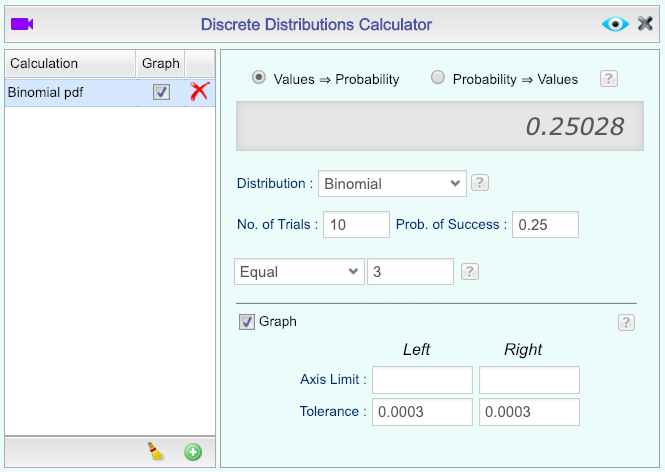
Binomial Distribution
Binomial Probability (pdf)
-
Open the Probability-Simulation toolbox on the left-hand side of the Rguroo window. Use the Probability dropdown menu, choose the Probability Calculator option, and then select Discrete.
-
Select the option Values ⇒ Probability.
-
Select Binomial as the Distribution, and enter the Number of Trials and Probability of Success.
-
Select the option Equal from the dropdown menu, then type the Number of Successes in the text field.
-
Adjust the other options appropriately, including checking the Graph option and editing the Calculation Name, if desired.

-
Click the preview icon
.
Binomial Probability Distribution
-
Open the Probability-Simulation toolbox on the left-hand side of the Rguroo window. Use the Probability dropdown menu, choose the Probability Calculator option, and then select Discrete.
-
Select the option Values ⇒ Probability.
-
Select Binomial as the Distribution and enter the Number of Trials and Probability of Success.
-
Select the option Equal from the dropdown menu. Then type the Number of Successes in the text field to the right.
-
Adjust the other options appropriately, including checking the Graph option and editing the Calculation Name, if desired.
-
Click the preview icon
.
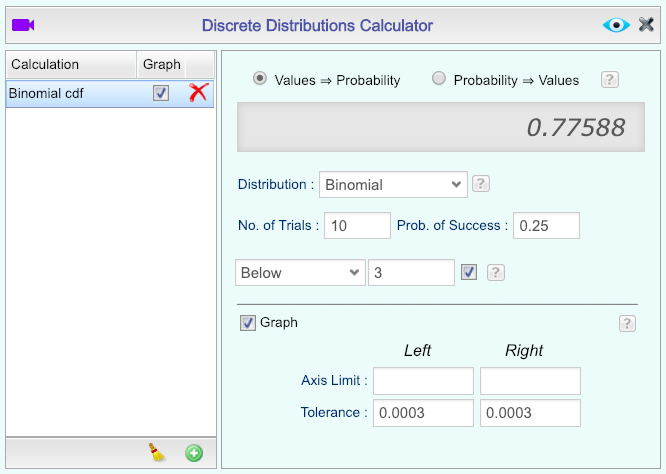
Binomial Probability (cdf)
-
Open the Probability-Simulation toolbox on the left-hand side of the Rguroo window. Use the Probability dropdown menu, choose the Probability Calculator option, and then select Discrete.
-
Select the option Values ⇒ Probability.
-
Select Binomial as the Distribution, and enter the Number of Trials and Probability of Success.
-
Select the option Below from the dropdown menu, then type the Number of Successes in the text field.
-
Adjust the other options appropriately, including selecting the Graph option and editing the Calculation Name, if desired.
-
Click the preview icon
to see the result.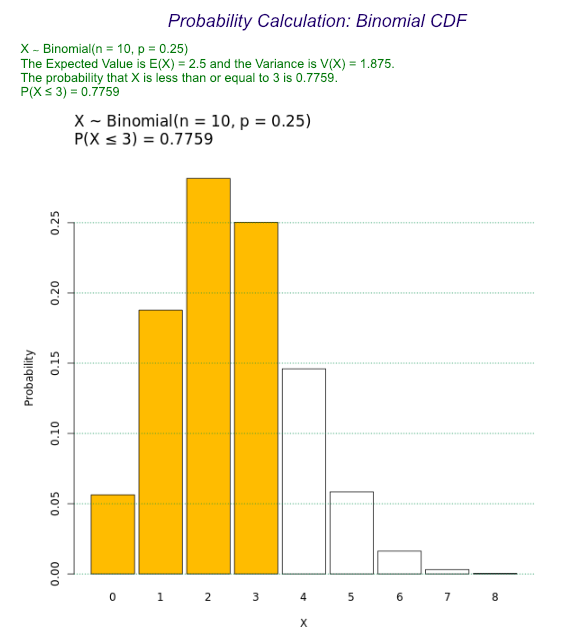
Chi-Square Distribution
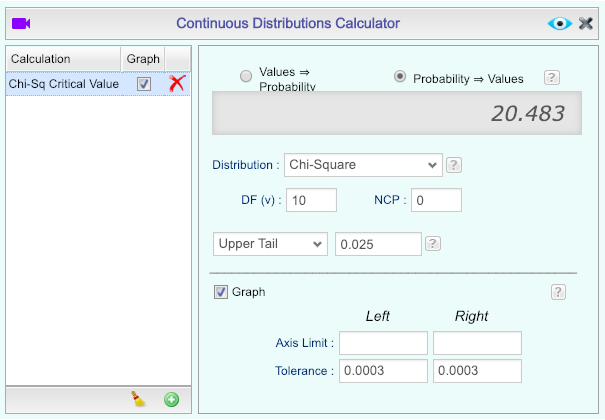
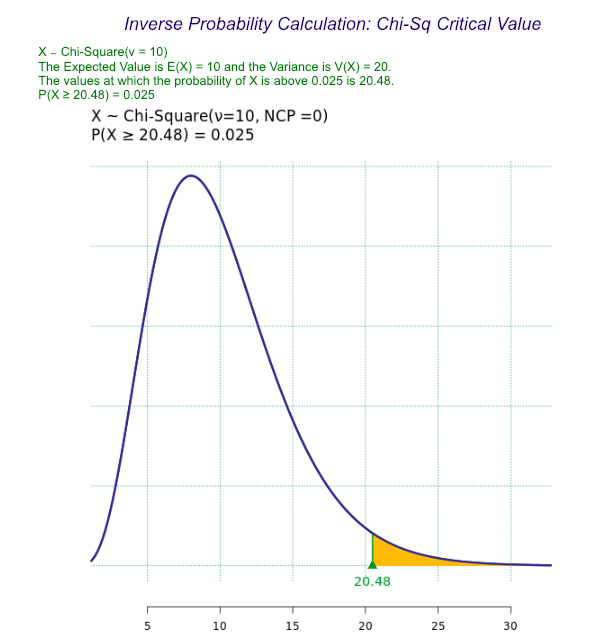
Critical Value
-
Open the Probability-Simulation toolbox on the left-hand side of the Rguroo window. Use the Probability dropdown menu, choose the Probability Calculator option, and then select Continuous.
-
Select the option Probability ⇒ Values.
-
Select Chi-Square as the Distribution, and enter the Degrees of Freedom (DF). Leave other parameters at default values.
-
Select the option Upper Tail from the dropdown menu, then type the desired probability in the text field.
-
Adjust the other options appropriately, including checking the Graph option and editing the Calculation Name, if desired.
-
Click the preview icon
.
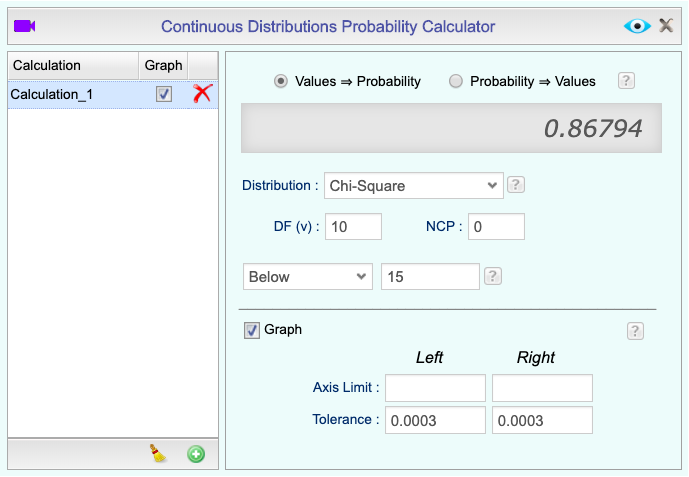
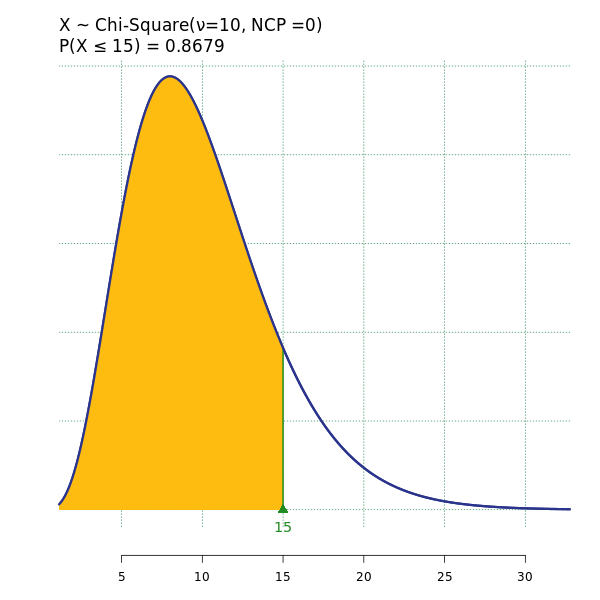
Left Tailed Probability (cdf)
-
Open the Probability-Simulation toolbox on the left-hand side of the Rguroo window. Use the Probability dropdown menu, choose the Probability Calculator option, and then select Continuous.
-
Select the option Values ⇒ Probability.
-
Select Chi-Square as the Distribution and enter the Degrees of Freedom (DF). Leave the other parameters at default values.
-
Select the option Below from the dropdown menu, then type the desired value in the text field.
-
Adjust the other options appropriately, including checking the Graph option and editing the Calculation Name, if desired.
-
Click the preview icon
.
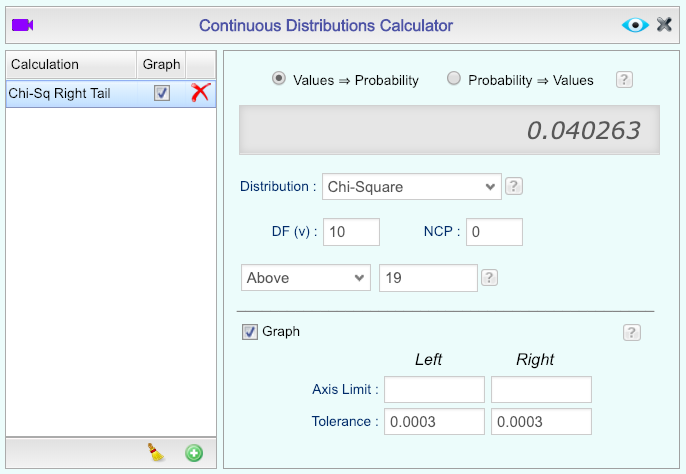
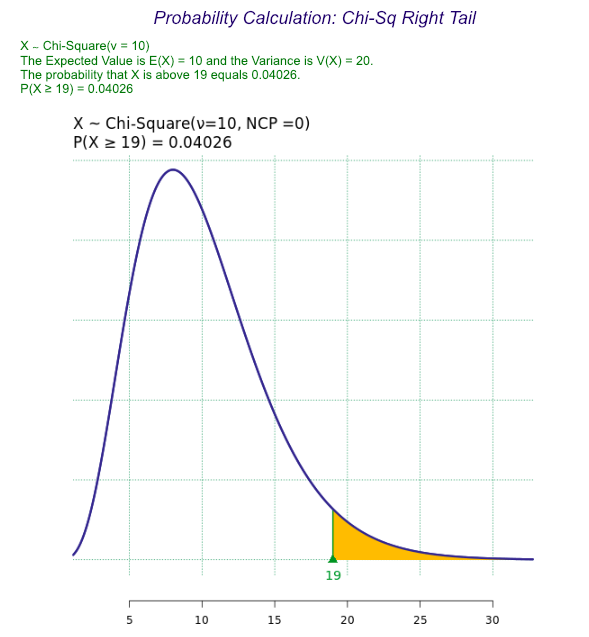
Right Tailed Probability (cdf)
-
Open the Probability-Simulation toolbox on the left-hand side of the Rguroo window. Use the Probability dropdown menu, choose the Probability Calculator option, and then select Continuous.
-
Select the option Values ⇒ Probability.
-
Select Chi-Square as the Distribution, and enter the Degrees of Freedom (DF). Leave other parameters at default values.
-
Select the option Above from the dropdown menu, then type the desired value in the text field.
-
Adjust the other options appropriately, including checking the Graph option and editing the Calculation Name, if desired.
-
Click the preview icon
.
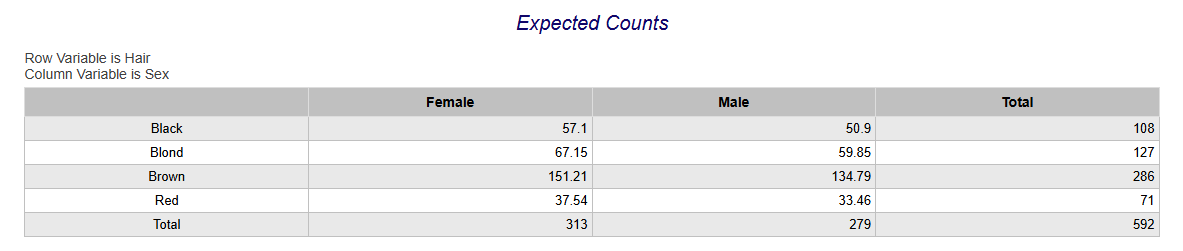
Test for Association
-
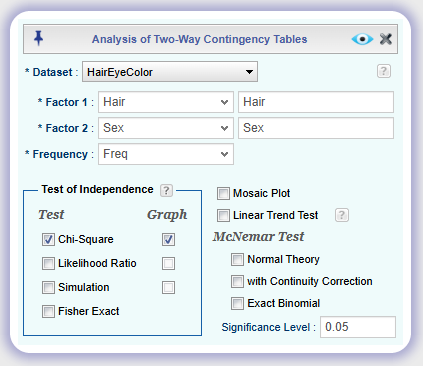
See Creating a Dataset to input your data or recreate the example below by Accessing the Rguroo Data Repository and using the 'HairEyeColor' dataset found in the 'R datasets' repository.
-
Open the Analytics toolbox on the left-hand side of the Rguroo window. Use the Analysis dropdown menu and choose the Contingency Table option.
-
-
Select a Dataset.
-
Select Factor 1 and Factor 2 variables.
-
If data are in tabular form, where frequencies are given as a separate variable, select the Frequency variable.
-
Under the Test of Independence section, check the Chi-Square checkbox (with Graph, if desired).
-
Set the Significance Level.
-
-
Click the preview icon
to see the result.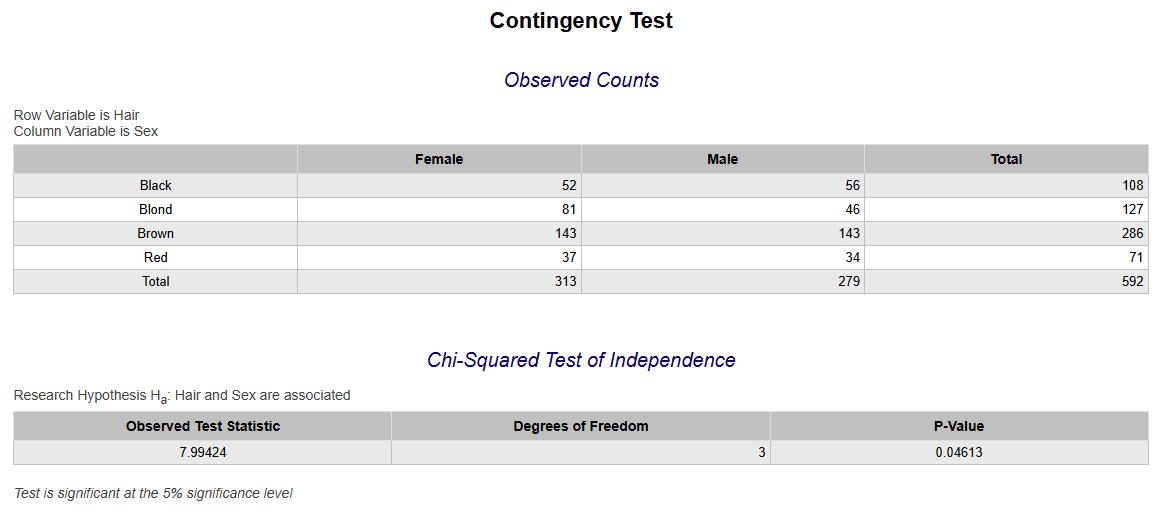
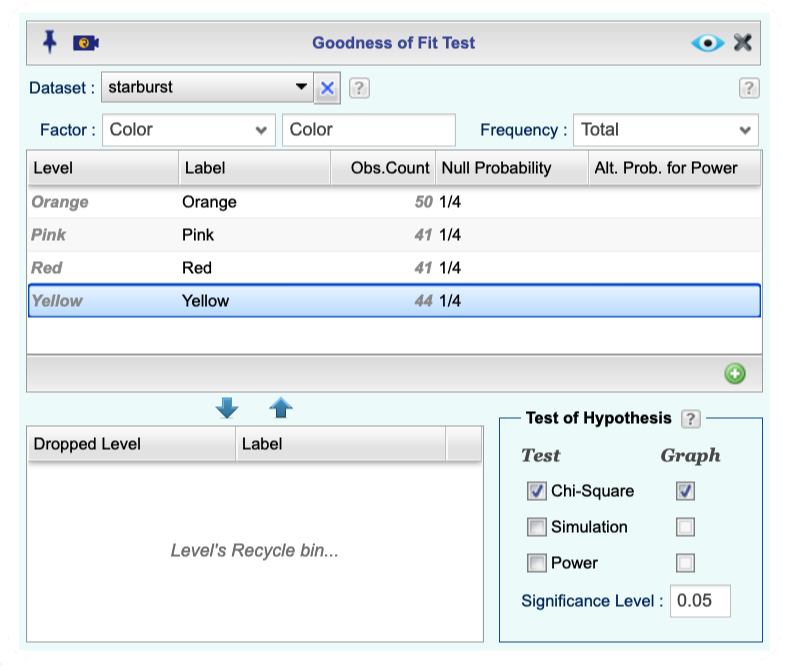
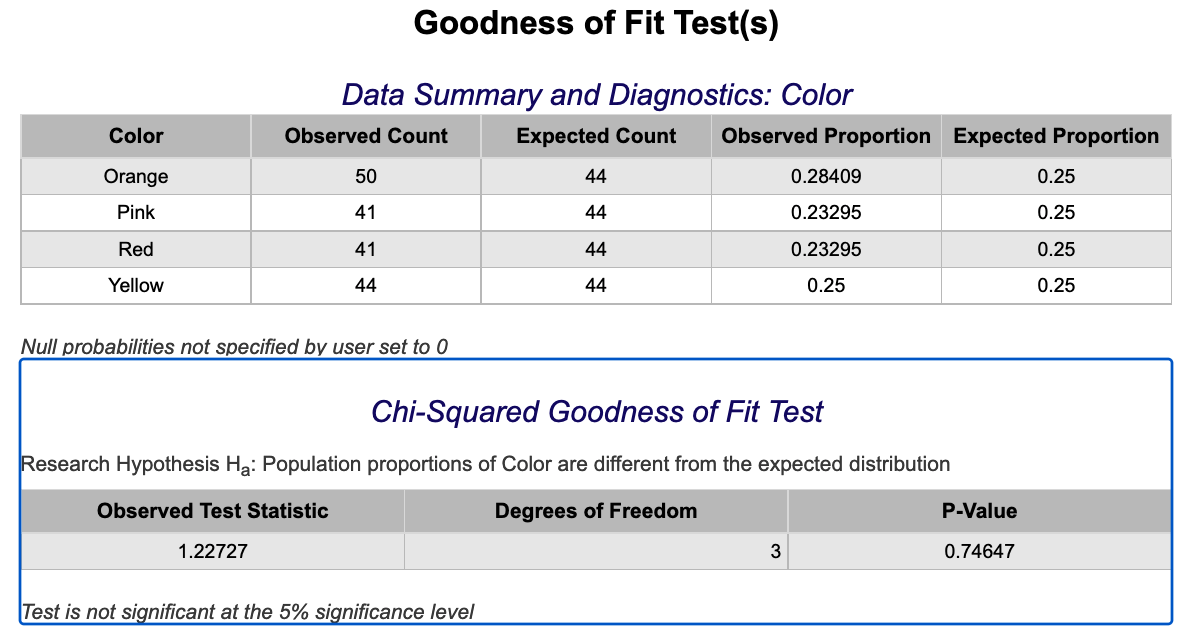
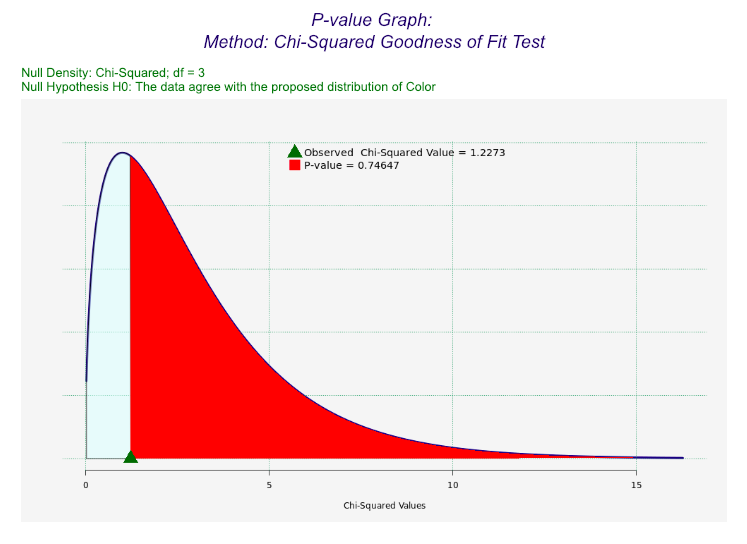
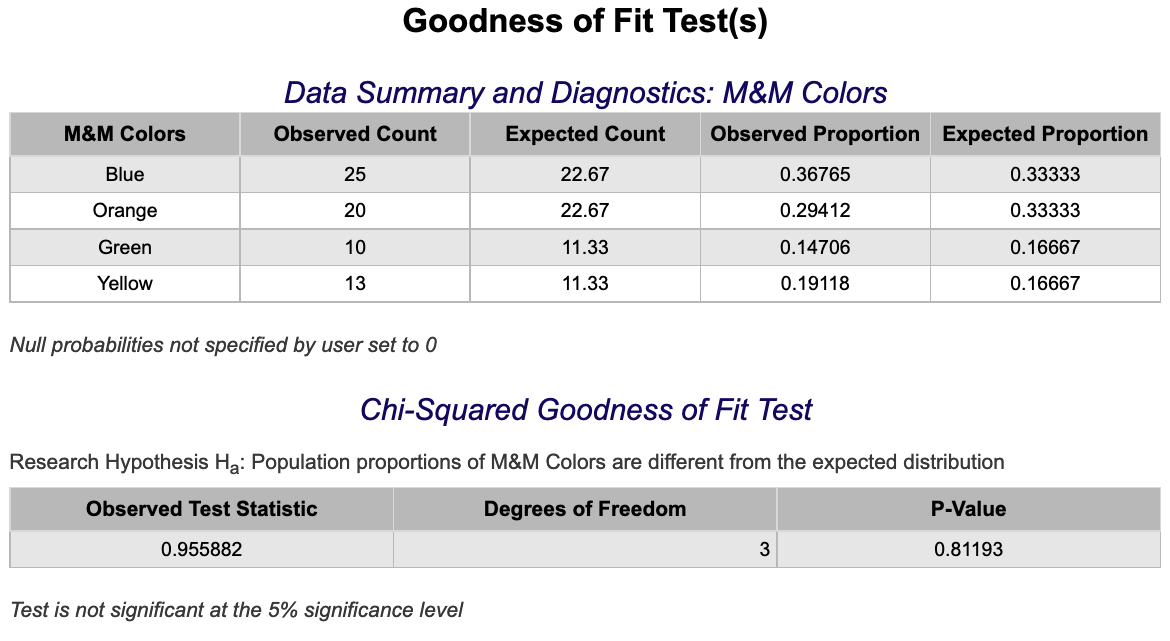
Test for Goodness of Fit
Test for Goodness of Fit with Dataset
-
See Creating a Dataset to input your data or recreate the example below by Accessing the Rguroo Data Repository and using the 'starburst' dataset found in the 'Rguroo Users Guide' repository.
-
Open the Analytics toolbox on the left-hand side of the Rguroo window. Use the Analysis dropdown menu and choose the Goodness of Fit option.
-
Select a Dataset and a Factor variable.
If your data are in tabular form, where frequencies are given as a separate variable, select the Frequency variable.
-
(optional) Under the Null Probability column, type in probabilities for each level. Probabilities can be typed in as fractions or decimals. If the Null Probability column is left blank, equal probability for all levels will be assumed.
-
Under the Test of Hypothesis section, check the Chi-Square checkbox (with Graph, if desired), then set the Significance Level.
-
Click the preview icon
.
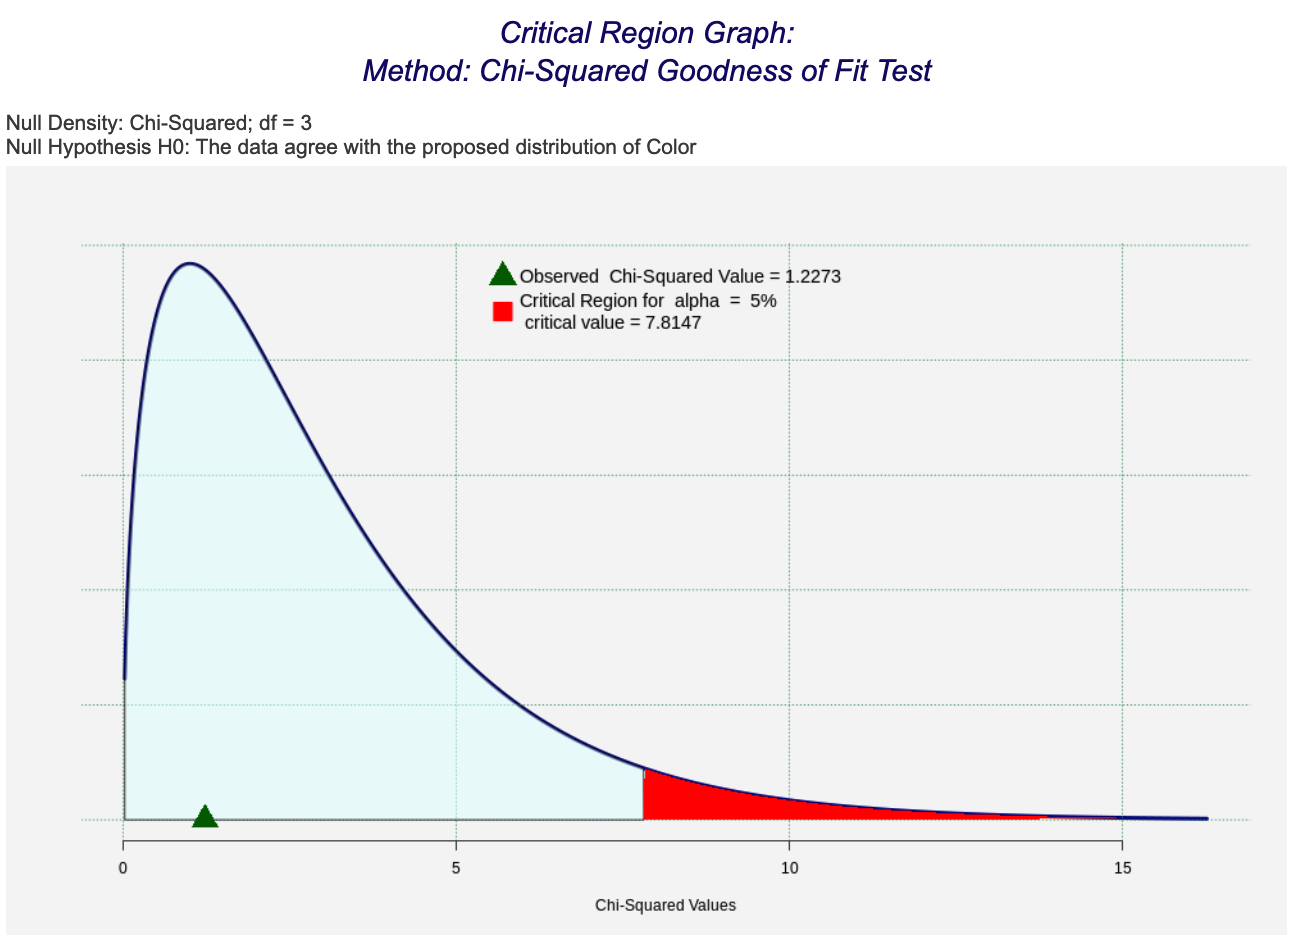
Test for Goodness of Fit without Dataset
-
Open the Analytics toolbox on the left-hand side of the Rguroo window. Use the Analysis dropdown menu and choose the Goodness of Fit option.
-
To enter data for each level, click the green plus button
 at the bottom right corner of the middle table. Double-click each cell to enter data. An easy way to move between cells is to use the tab key on your keyboard.
-
Enter a level name and a corresponding label name under the columns Level and Label, respectively.
-
Enter the observed count for the level under Obs. Count column.
-
Enter the null probability for the level under Null Probability. If the Null Probability column is left blank, equal probability for all levels will be assumed.
-
-
Under the Test of Hypothesis section, check the Chi-Square checkbox (with Graph, if desired), then set the Significance Level.
-
Click the preview icon
.
Confidence Intervals
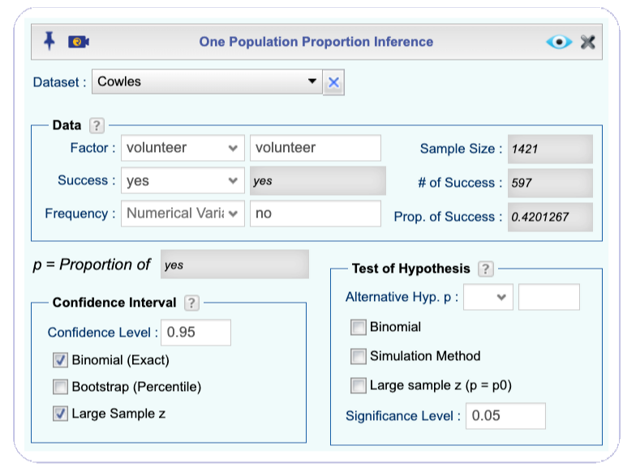
Proportion
Using Raw Data
-
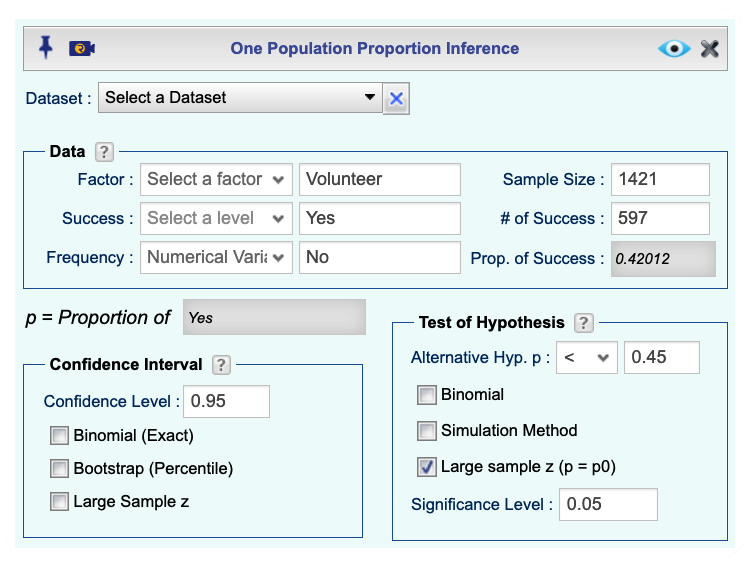
See Creating a Dataset to input your data or recreate the example below by Accessing the Rguroo Data Repository and using the 'Cowles' dataset found in the 'car' repository.
-
Open the Analytics toolbox on the left-hand side of the Rguroo window. Use the Analysis dropdown menu, choose the Proportion Inference option, and then select One Population.
-
Select a Dataset, Factor variable, and Success level. The summary statistics will be automatically populated.
-
Under the Confidence Interval section, set the Confidence Level and check the checkboxes for Binomial (Exact) and Large Sample z.
-
Click the preview icon
to see the result.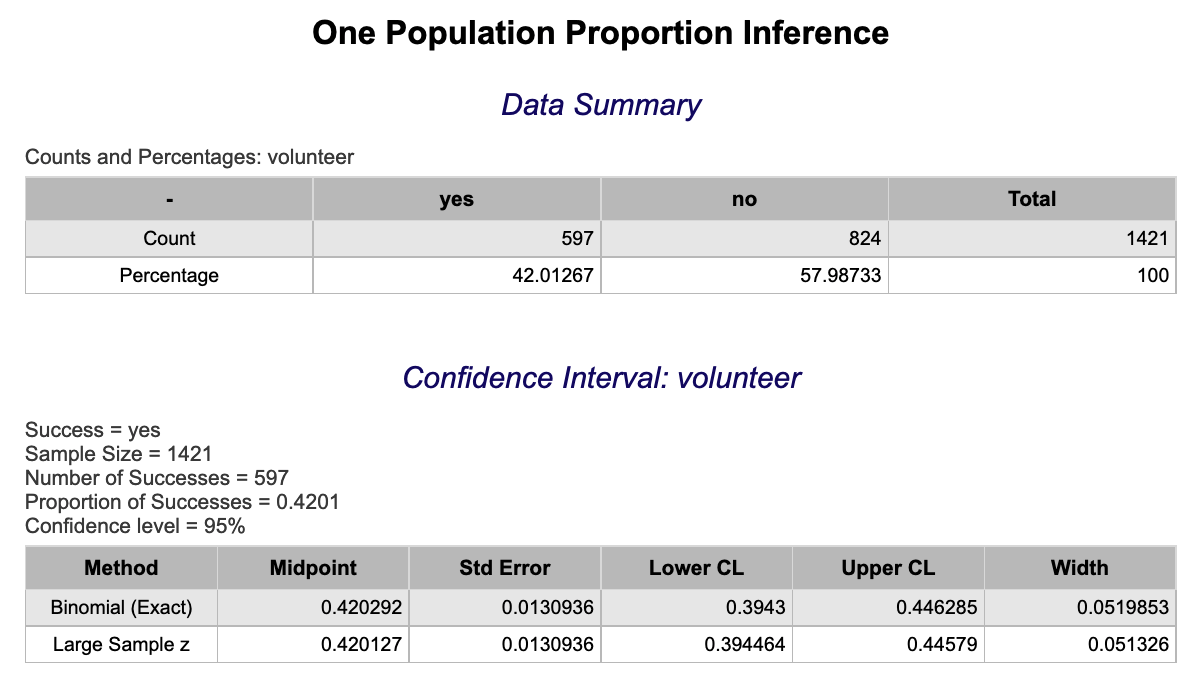
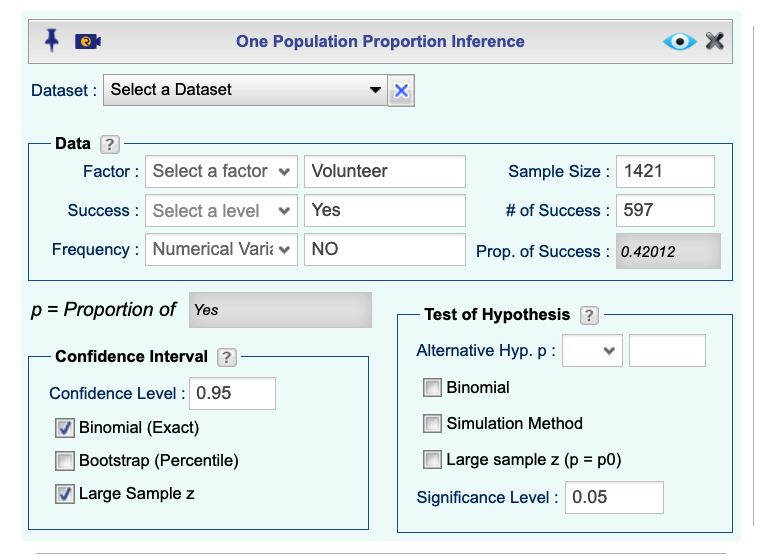
Using Summary Statistics
-
Open the Analytics toolbox on the left-hand side of the Rguroo window. Use the Analysis dropdown menu, choose the Proportion Inference option, and then select One Population.
-
Fill in labels for Factor, Success, and optionally Failure.
-
Fill in values for Sample Size and # of Success.
-
Under the Confidence Interval section, set the Confidence Level and check the checkboxes for Binomial (Exact) and Large Sample z.
-
Click the preview icon
to see the result.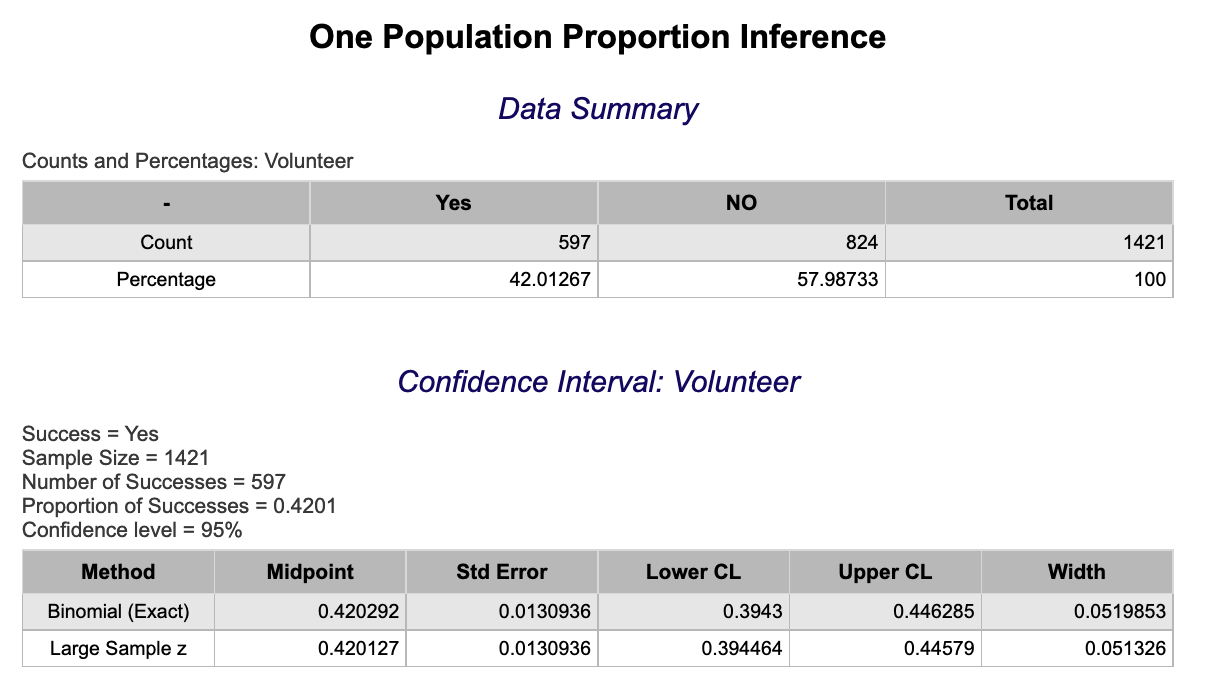
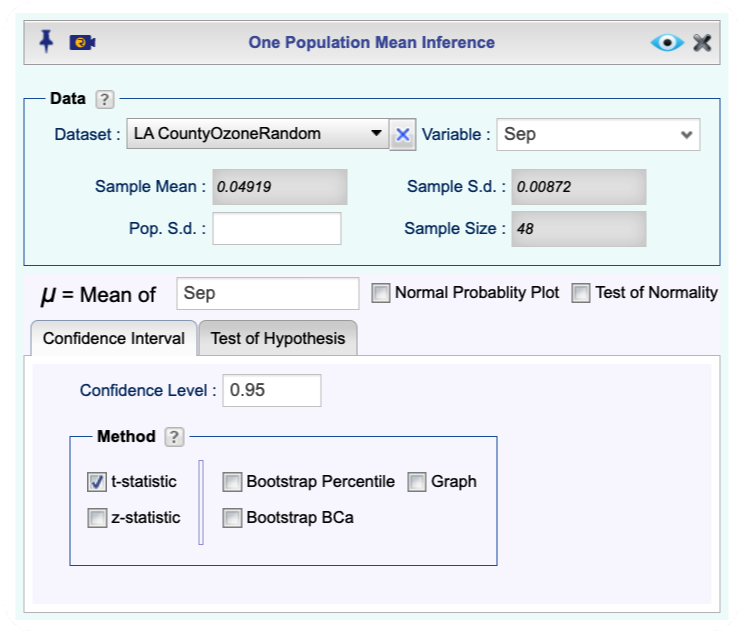
t-Interval
Using Raw Data
-
See Creating a Dataset to input your data or recreate the example below by Accessing the Rguroo Data Repository and using the 'LA CountyOzoneRandom' dataset found in the 'Rguroo Users Guide' repository.
-
Open the Analytics toolbox on the left-hand side of the Rguroo window. Use the Analysis dropdown menu, choose the Mean Inference option, and then select One Population.
-
Select a Dataset and a Variable.
-
Under the Confidence Interval tab check the t-statistic checkbox and enter a Confidence Level.
-
Click the preview icon
to see the result.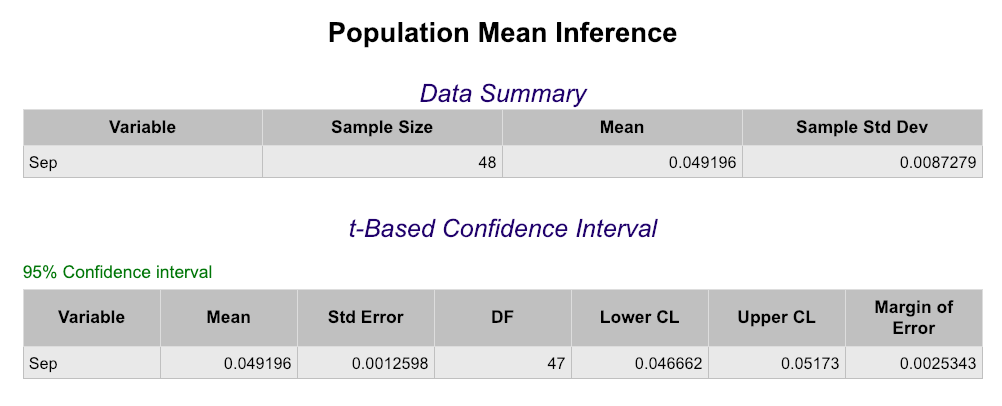
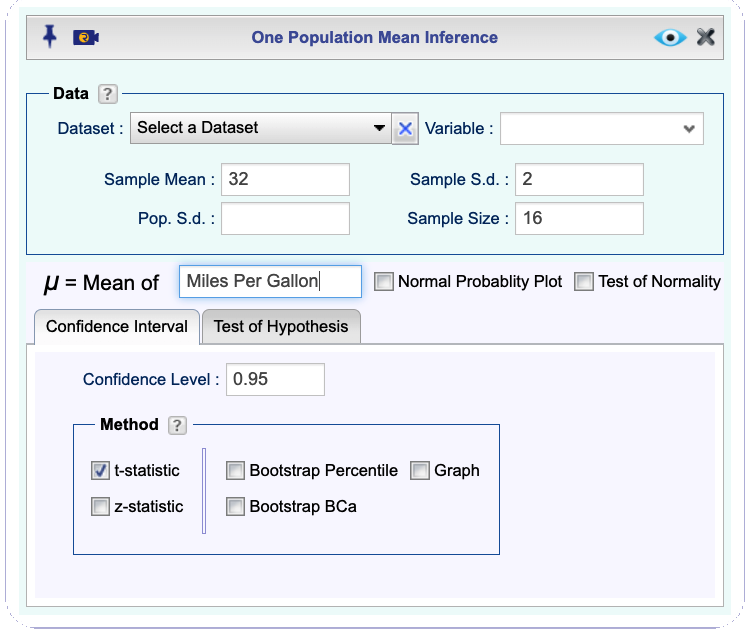
Using Summary Statistics
-
Open the Analytics toolbox on the left-hand side of the Rguroo window. Use the Analysis dropdown menu, choose the Mean Inference option, and then select One Population.
-
Fill out the values for Sample Mean, Sample S.d., and Sample Size.
-
Write a label for the parameter in the text box μ = Mean of.
-
Under the Confidence Interval tab check the t-statistic checkbox, and enter a Confidence Level.
-
Click the preview icon
to see the result.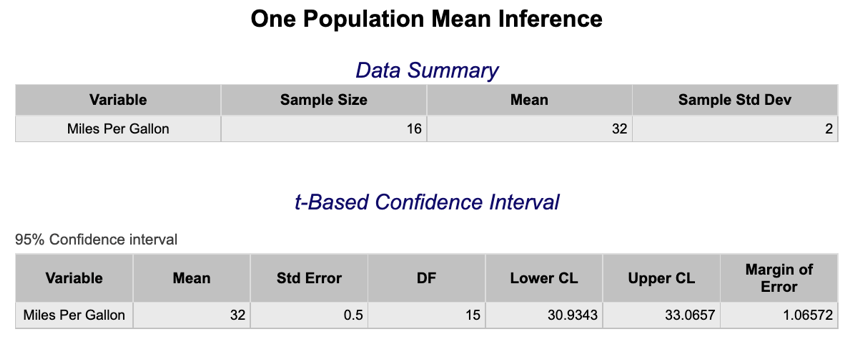
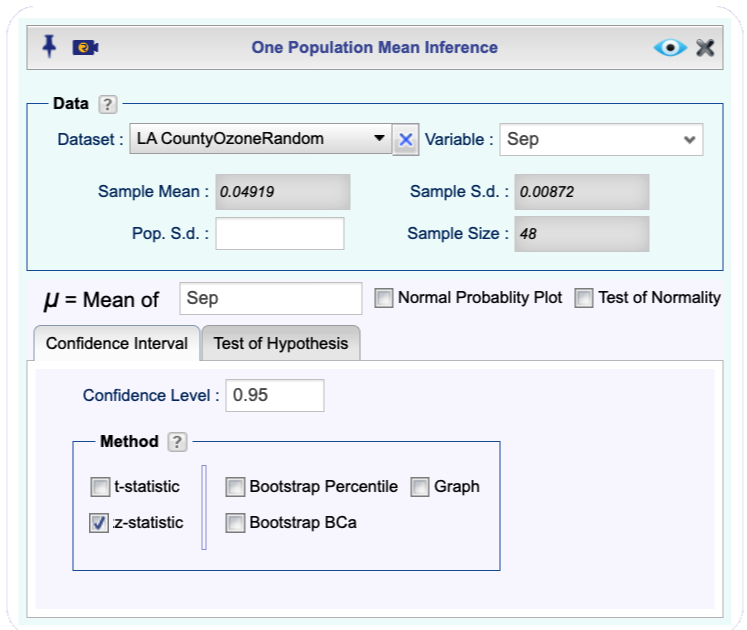
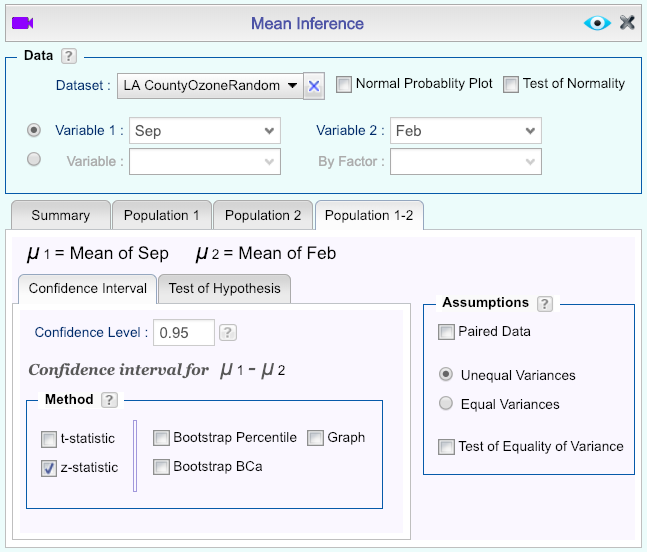
z-Interval
Using Raw Data
-
See Creating a Dataset to input your data or recreate the example below by Accessing the Rguroo Data Repository and using the 'LA CountyOzoneRandom' dataset found in the 'Rguroo Users Guide' repository.
-
Open the Analytics toolbox on the left-hand side of the Rguroo window. Use the Analysis dropdown menu, choose the Mean Inference option, and then select One Population.
-
Select a Dataset and a Variable. If the population standard deviation is known, type it in the Pop. S.d. textbox.
-
Under the Confidence Interval tab check the z-statistic checkbox and enter a Confidence Level.
-
Click the preview icon
to see the result.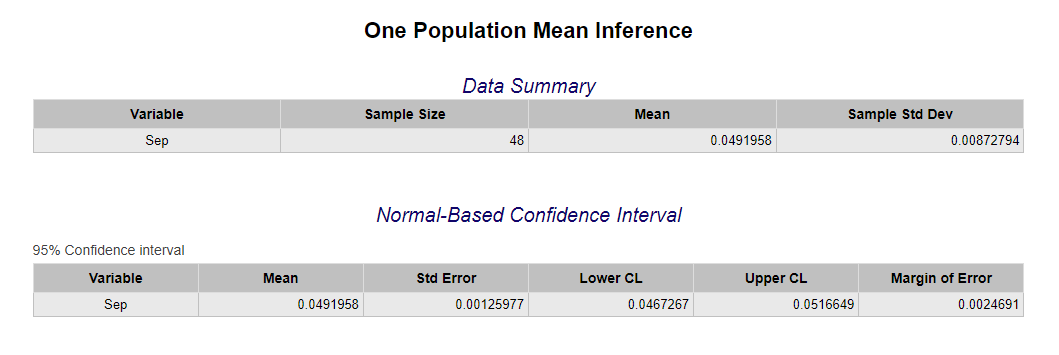
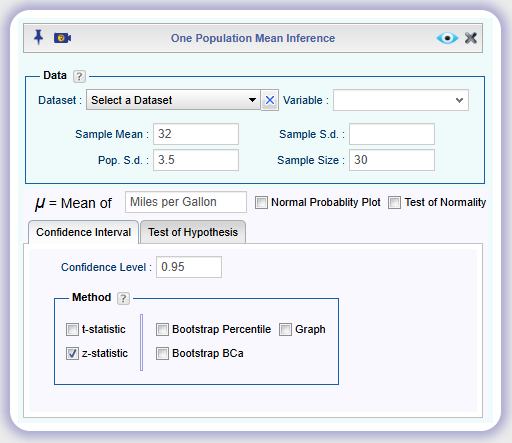
Using Summary Statistics
-
Open the Analytics toolbox on the left-hand side of the Rguroo window. Use the Analysis dropdown menu, choose the Mean Inference option, and then select One Population.
-
Fill out the values for Sample Mean, Pop. S.d., and Sample Size.
-
Write a label for the parameter in the text box μ = Mean of.
-
Under the Confidence Interval tab check the z-statistic checkbox and enter a Confidence Level.
-
Click the preview icon
to see the result.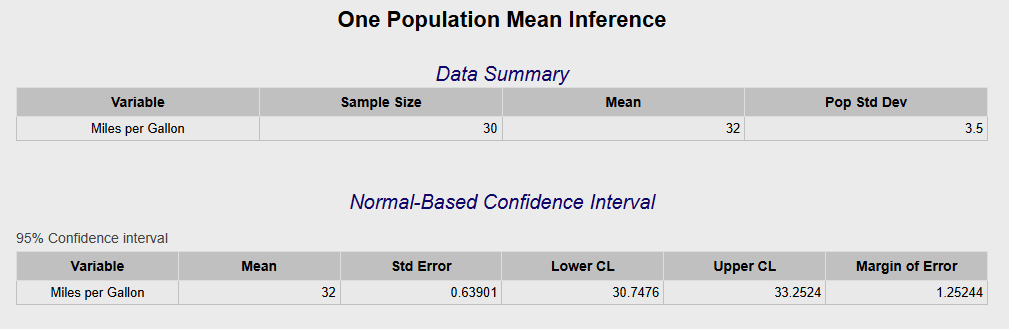
Two Sample t-Interval (Dependent Samples, Paired Difference)
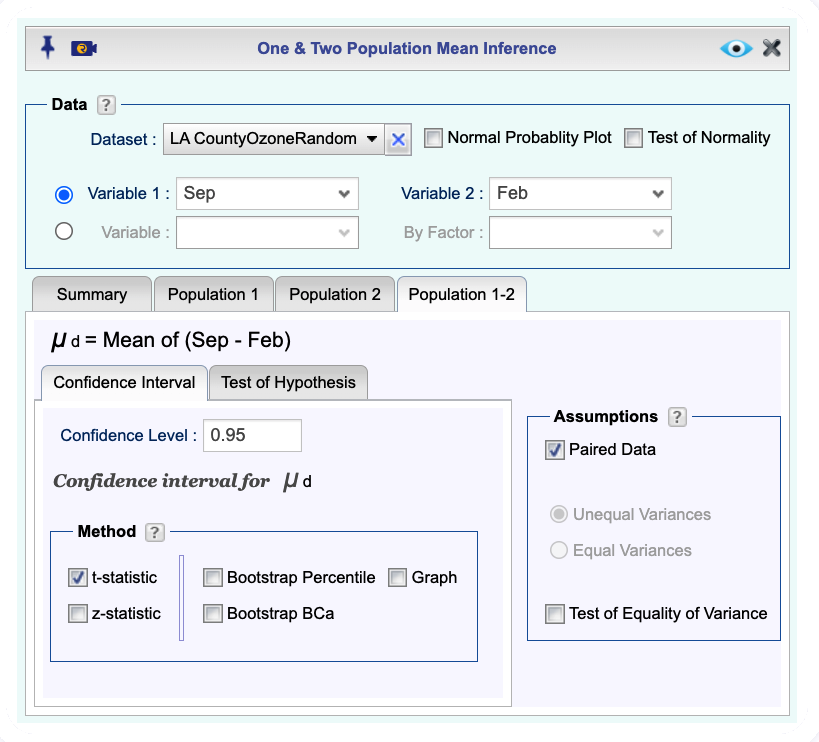
Using Raw Data
-
See Creating a Dataset to input your data or recreate the example below by Accessing the Rguroo Data Repository and using the 'LA CountyOzoneRandom' dataset found in the 'Rguroo Users Guide' repository.
-
Open the Analytics toolbox on the left-hand side of the Rguroo window. Use the Analysis dropdown menu, choose the Mean Inference option, and then select One & Two Population.
-
Select a Dataset, Variable 1, and Variable 2. The summary statistics in the Summary tab will be automatically populated.
Note, if the populations are identified by a categorical variable, use the option of Variable and By Factor. Also, the number of cases for both populations must be the same for paired data.
-
Check the Paired Data checkbox. The summary data for paired differences will show in the Summary tab.
-
Open the Population 1-2 tab, then the Confidence Interval tab. Set the Confidence Level and check the t-statistic checkbox.
-
Click the preview icon
to see the result.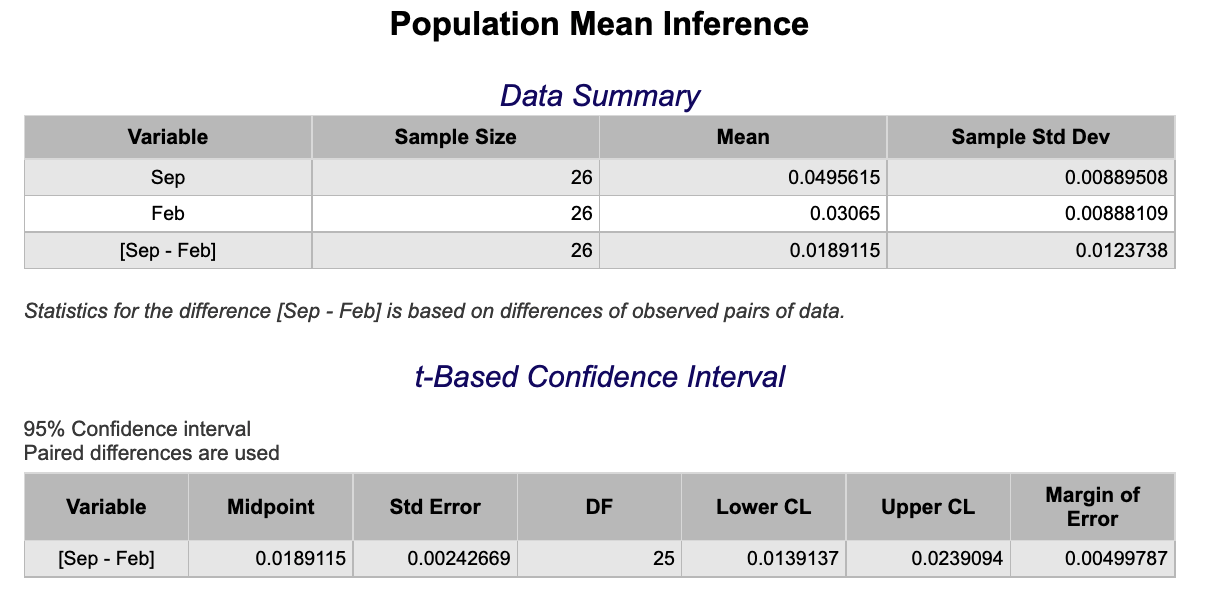
Using Summary Statistics
-
Open the Analytics toolbox on the left-hand side of the Rguroo window. Use the Analysis dropdown menu, choose the Mean Inference option, and then select One & Two Population.
-
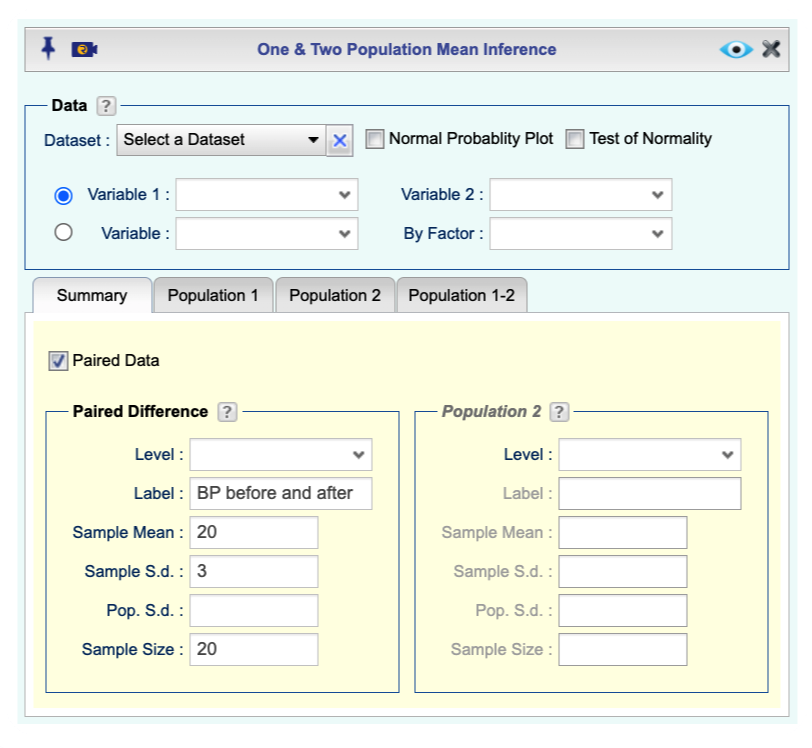
Under the Summary tab check the Paired Data checkbox.
-
In the Paired Difference section of the Summary tab, enter your data:
-
Type in a Label.
-
In the Sample Mean textbox, type the mean of the paired differences.
-
In the Sample S.d. textbox, type the sample standard deviation of the paired differences.
-
In the Sample Size textbox, type the sample size.
-
-
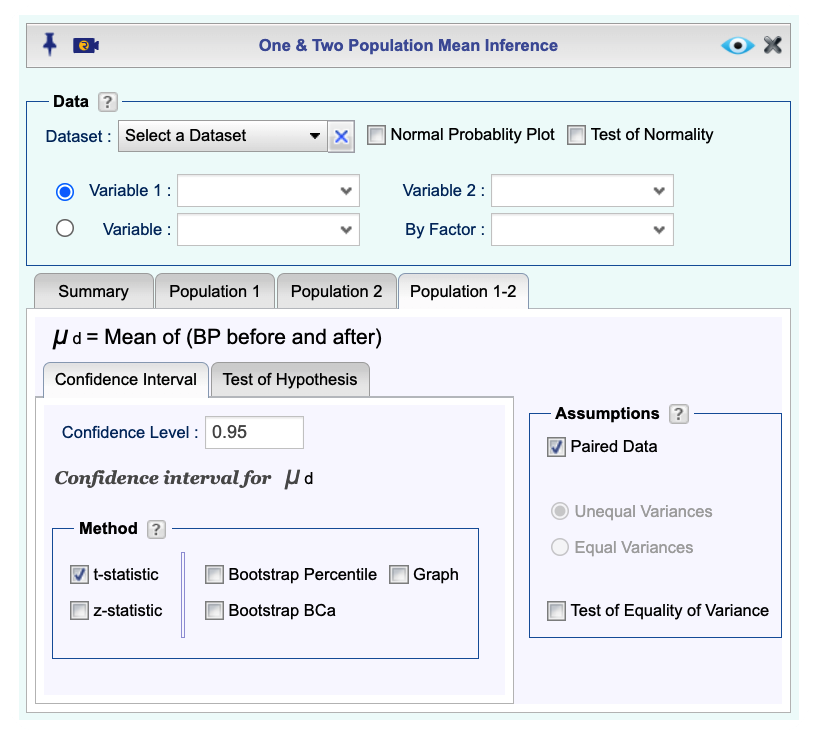
Open the Population 1-2 tab, then the Confidence Interval tab. Set the Confidence Level and check the t-statistic checkbox.
-
Click the preview icon
to see the result.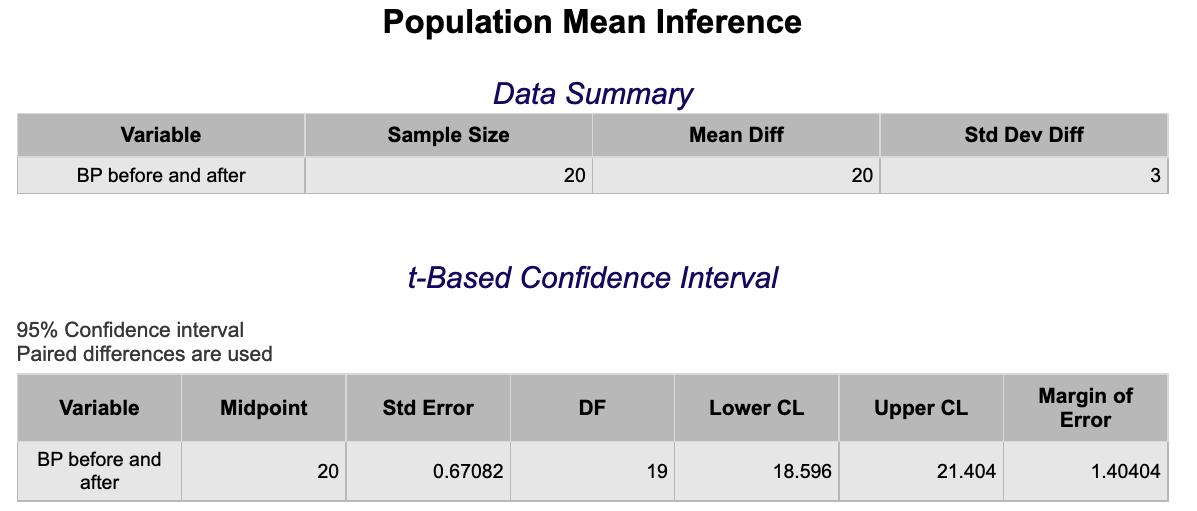
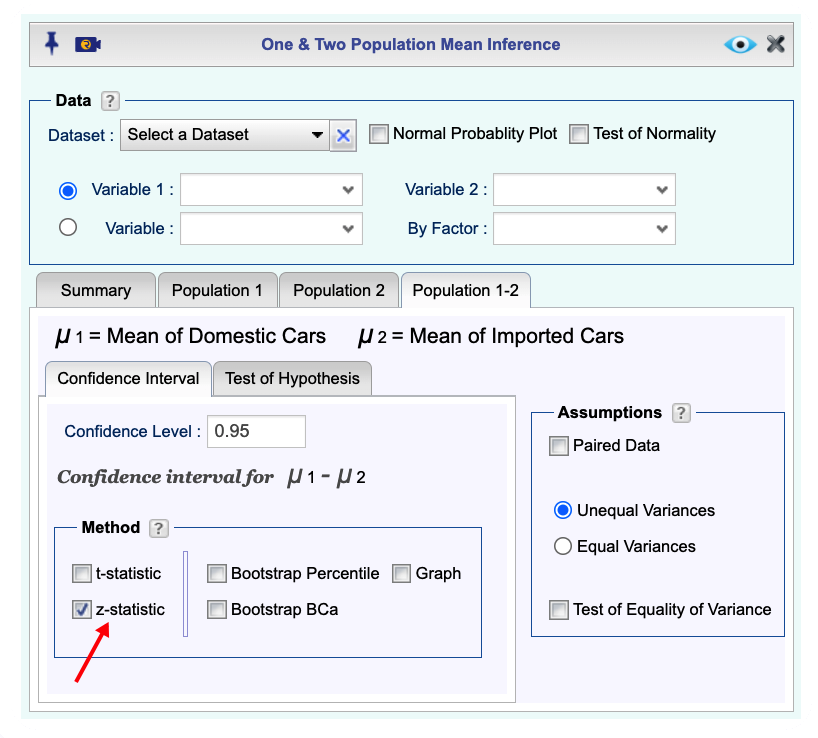
Two Sample t-Interval (Independent Samples)
Using Raw Data
-
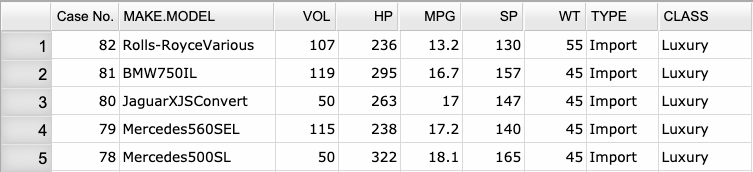
See Creating a Dataset to input your data or recreate the example below by Accessing the Rguroo Data Repository and using the 'cardata' dataset found in the 'Rguroo Users Guide' repository.
-
Open the Analytics toolbox on the left-hand side of the Rguroo window. Use the Analysis dropdown menu, choose the Mean Inference option, and then select One & Two Population.
-
-
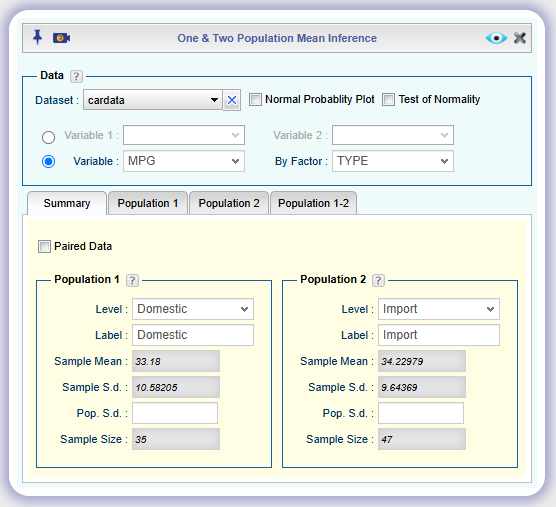
Select a Dataset.
-
If the populations are identified by a quantitative variable, select a Variable 1, and a Variable 2. The summary statistics in the Summary tab will be automatically populated.
If the populations are identified by a categorical variable, use the option of Variable and By Factor. Under the Summary tab, select a level for each population.
-
-
Open the Population 1-2 tab, then the Confidence Interval tab. Set the Confidence Level and check the t-statistic checkbox.
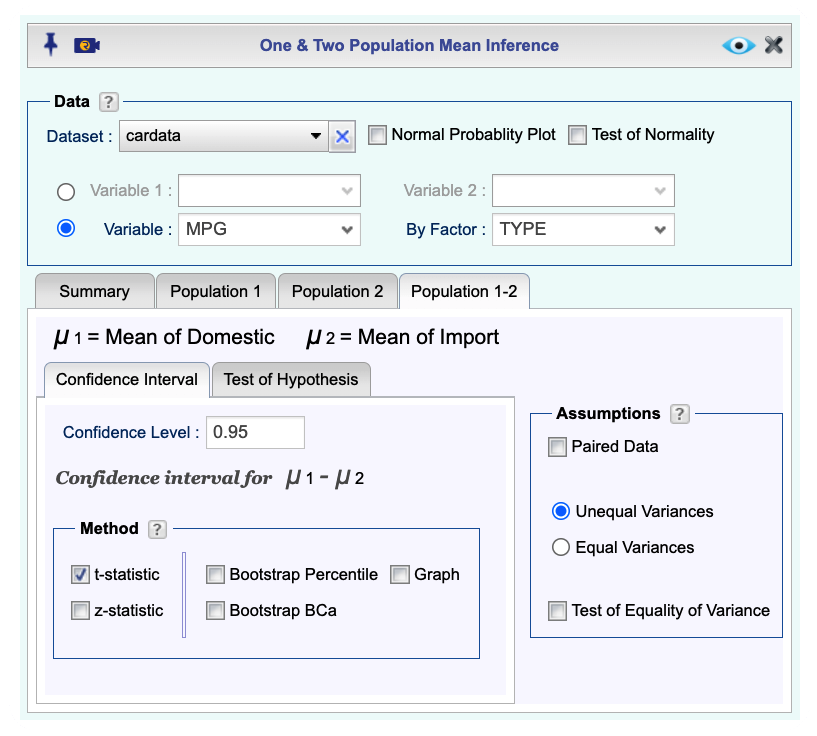
-
Click the preview icon
to see the result.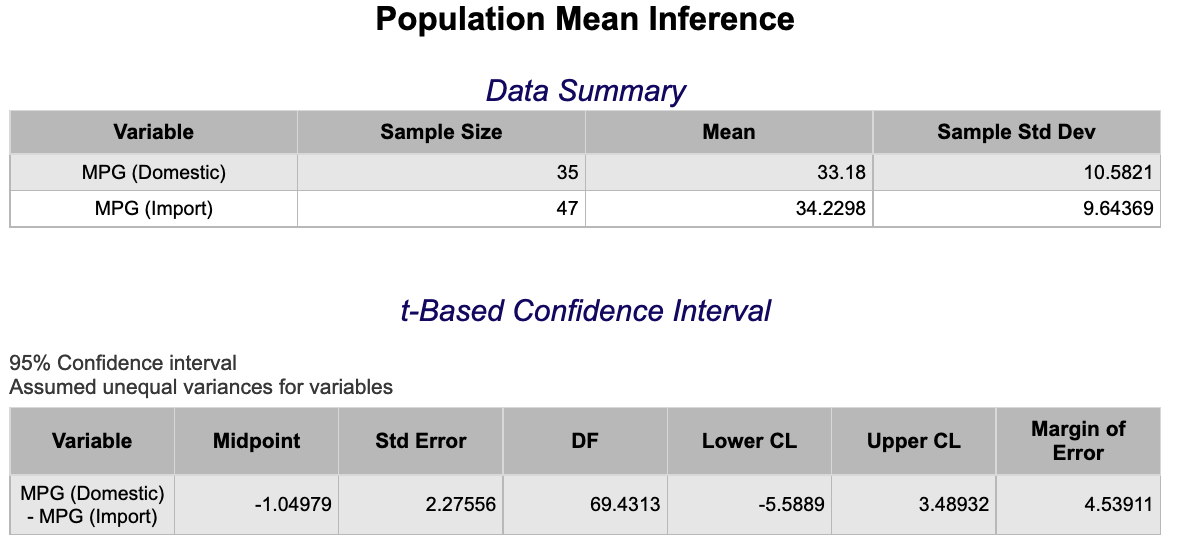
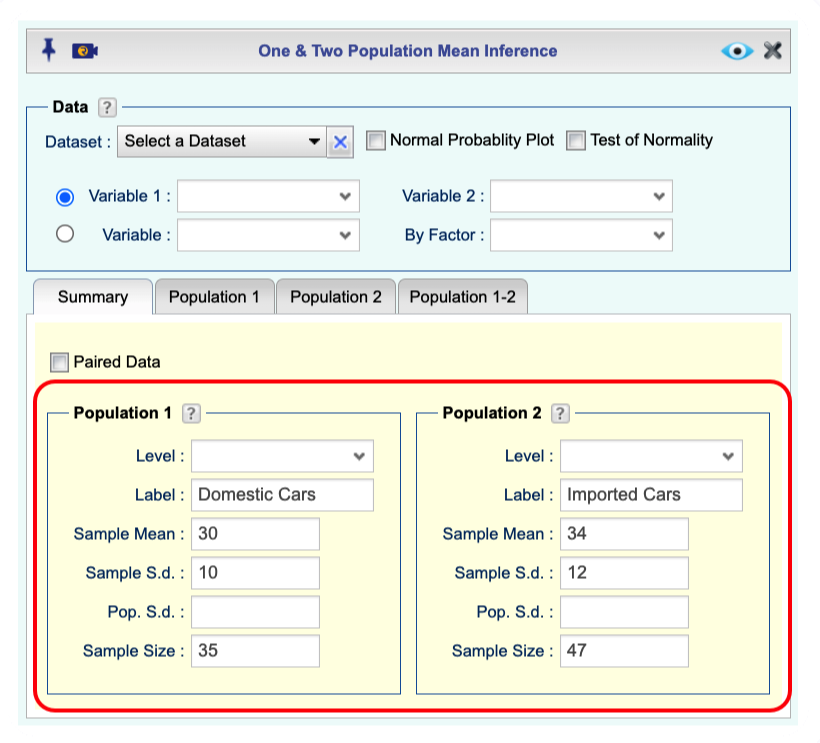
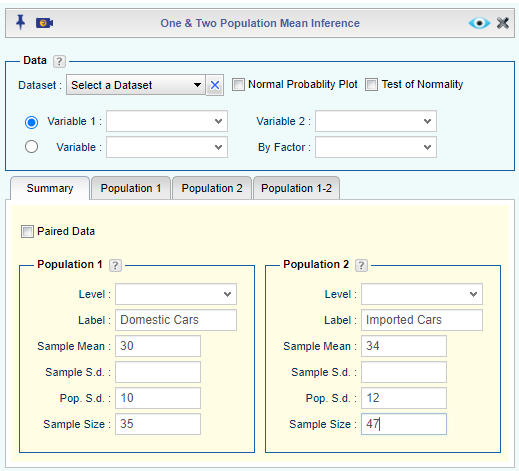
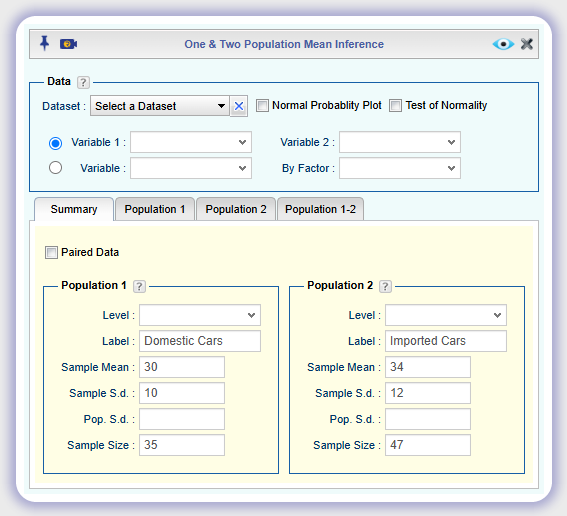
Using Summary Statistics
-
Open the Analytics toolbox on the left-hand side of the Rguroo window. Use the Analysis dropdown menu, choose the Mean Inference option, and then select One & Two Population.
-
In the Summary tab
-
Under the Population 1 Section, type Label, Sample Mean, Sample S.d. (or Pop. S.d.), and Sample Size for Population 1.
-
Under the Population 2 Section, type Label, Sample Mean, Sample S.d. (or Pop. S.d.), and Sample Size for Population 2.
-
-
Open the Population 1-2 tab, then the Confidence Interval tab. Set the Confidence Level and check the t-statistic checkbox.
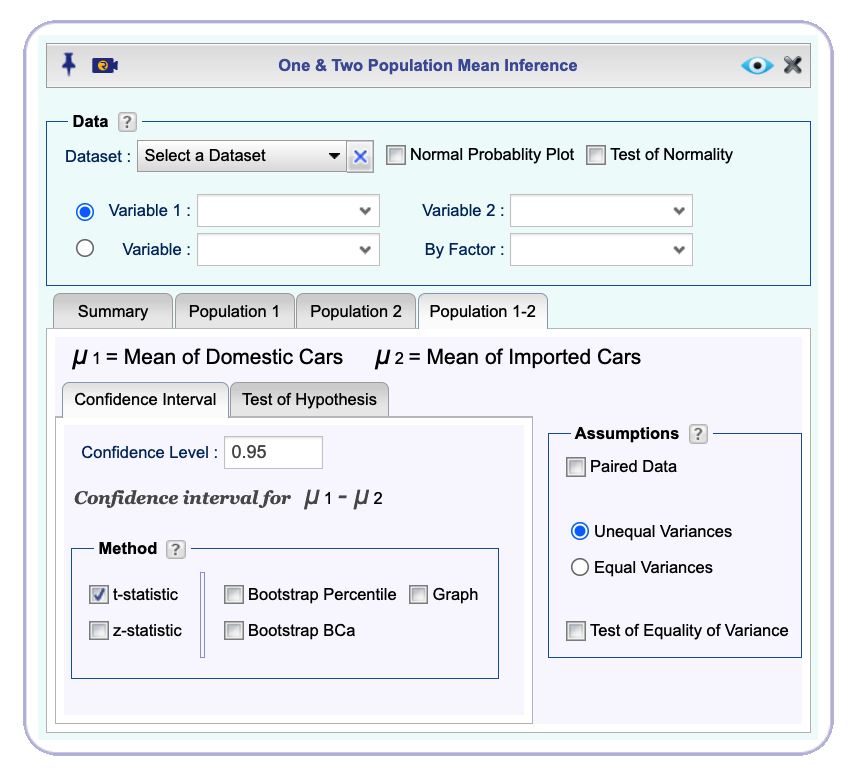
-
Click the preview icon
to see the result.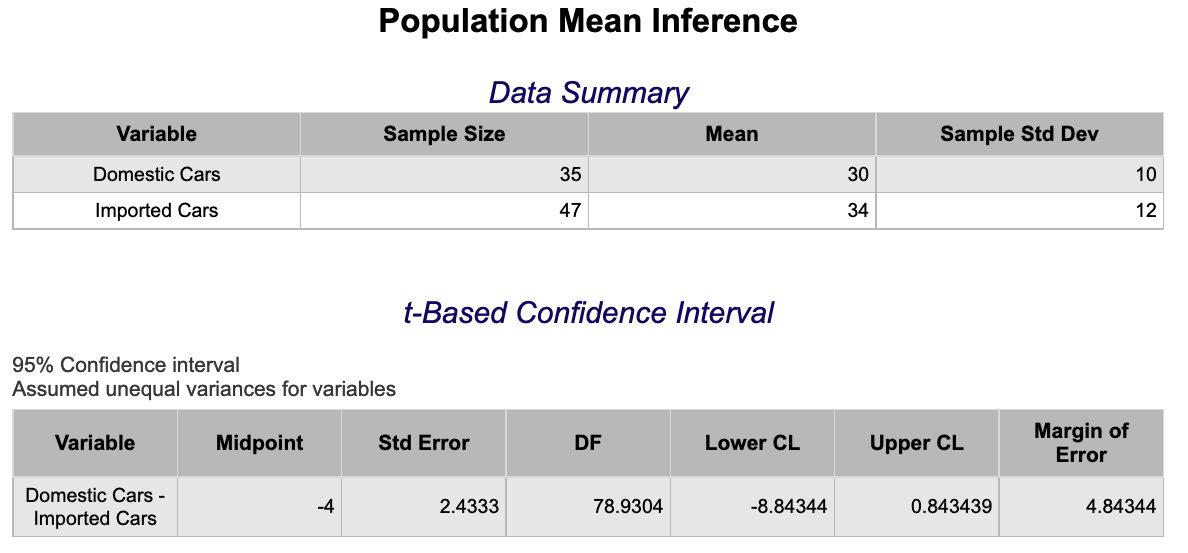
Two Sample z-Interval
Using Raw Data
-
See Creating a Dataset to input your data or recreate the example below by Accessing the Rguroo Data Repository and using the 'LA CountyOzoneRandom' dataset found in the 'Rguroo Users Guide' repository.
-
Open the Analytics toolbox on the left-hand side of the Rguroo window. Use the Analysis dropdown menu, choose the Mean Inference option, and then select One & Two Population.
-
Select a Dataset, Variable 1, and Variable 2. The summary statistics in the Summary tab will be automatically populated.
Note, if the populations are identified by a categorical variable, use the option of Variable and By Factor.
-
Open the Population 1-2 tab, then open the Confidence Interval tab. Set the Confidence Level and check the z-statistic checkbox.
-
Click the preview icon
to see the result.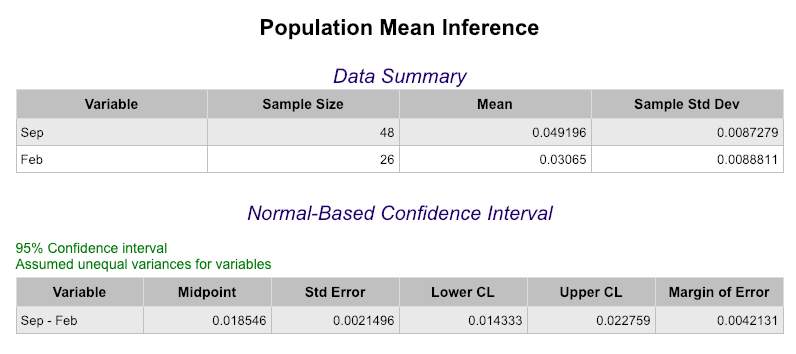
Using Summary Statistics
-
Open the Analytics toolbox on the left-hand side of the Rguroo window. Use the Analysis dropdown menu, choose the Mean Inference option, and then select One & Two Population.
-
In the Summary tab
-
Under the Population 1 Section, type Label, Sample Mean, Pop. S.d., and Sample Size for Population 1.
-
Under the Population 2 Section, type Label, Sample Mean, Pop. S.d., and Sample Size for Population 2.
-
-
Open the Population 1-2 tab, then the Confidence Interval tab. Set the Confidence Level and check the z-statistic checkbox.
-
Click the preview icon
to see the result.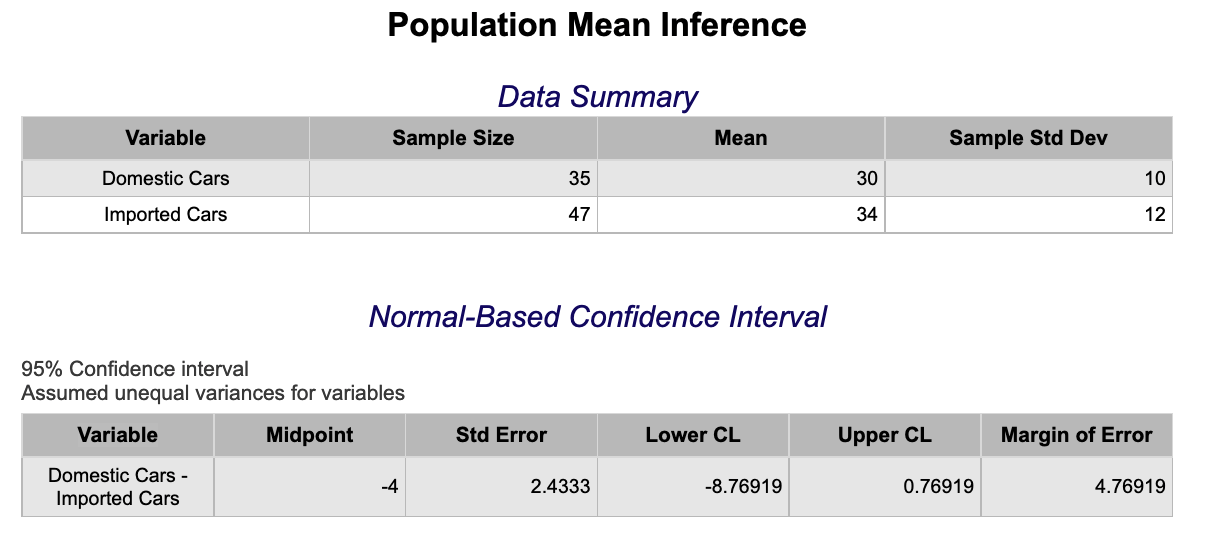
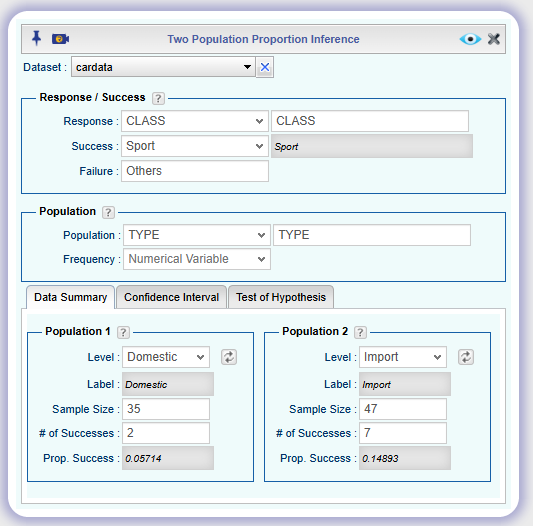
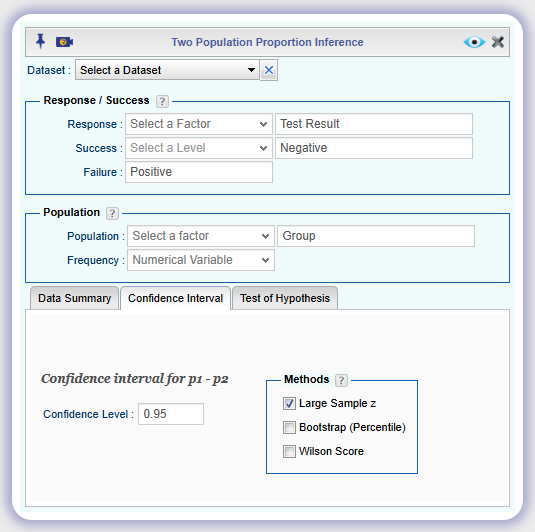
Two Sample Proportions z-Interval
Using Raw Data
-
See Creating a Dataset to input your data or recreate the example below by Accessing the Rguroo Data Repository and using the 'cardata' dataset found in the 'Rguroo Users Guide' repository.
-
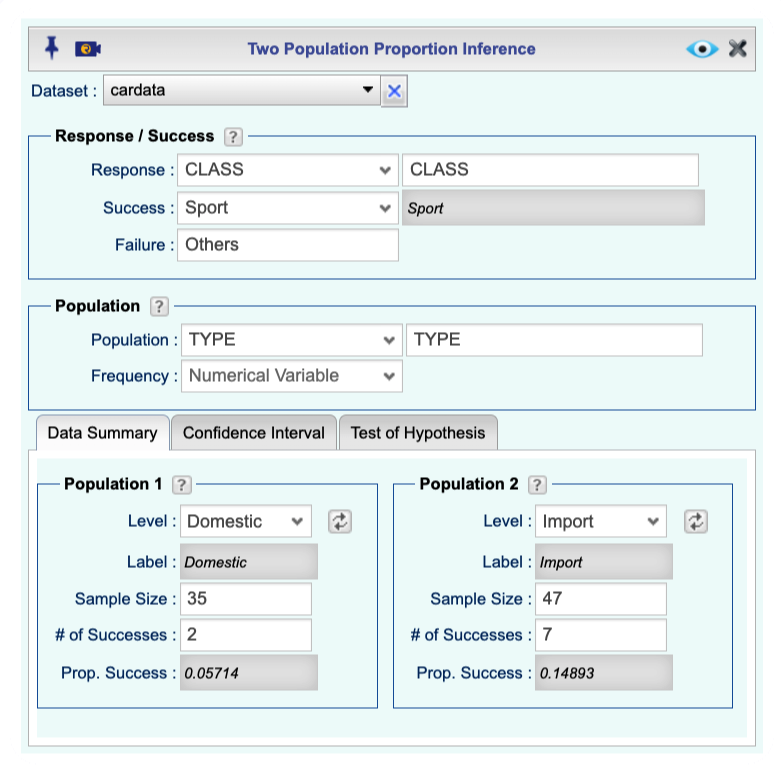
Open the Analytics toolbox on the left-hand side of the Rguroo window. Use the Analysis dropdown menu, choose the Proportion Inference option, and then select Two Populations.
-
-
Select a Dataset.
-
In the Response/Success section, select a Response variable and the level indicating Success. Optionally, you can type in a label for Failure.
-
In the Population section, select a variable for Population that indicates the population (explanatory variable). If your data is in tabular form, you can select the numerical variable that includes the Frequency for each level.
-
In the Data Summary tab, for each of Population 1 and Population 2 choose the corresponding Level. Clicking on the refresh button will load the Sample Size, # of Successes, and Proportion of Success for each population.
-
-
Select the Confidence Interval tab. Specify the Confidence Level and check the Large Sample z checkbox.
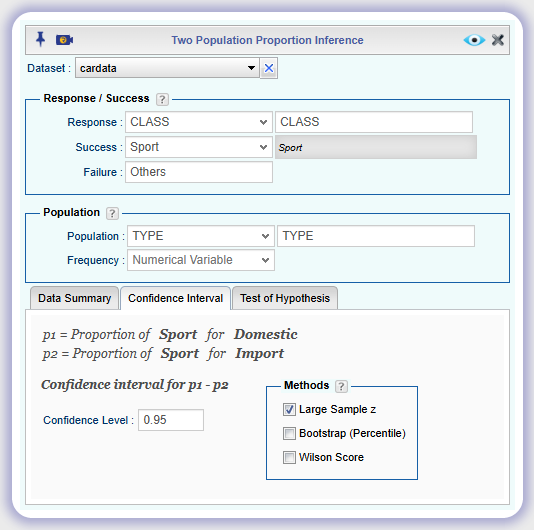
-
Click the preview icon
to see the result.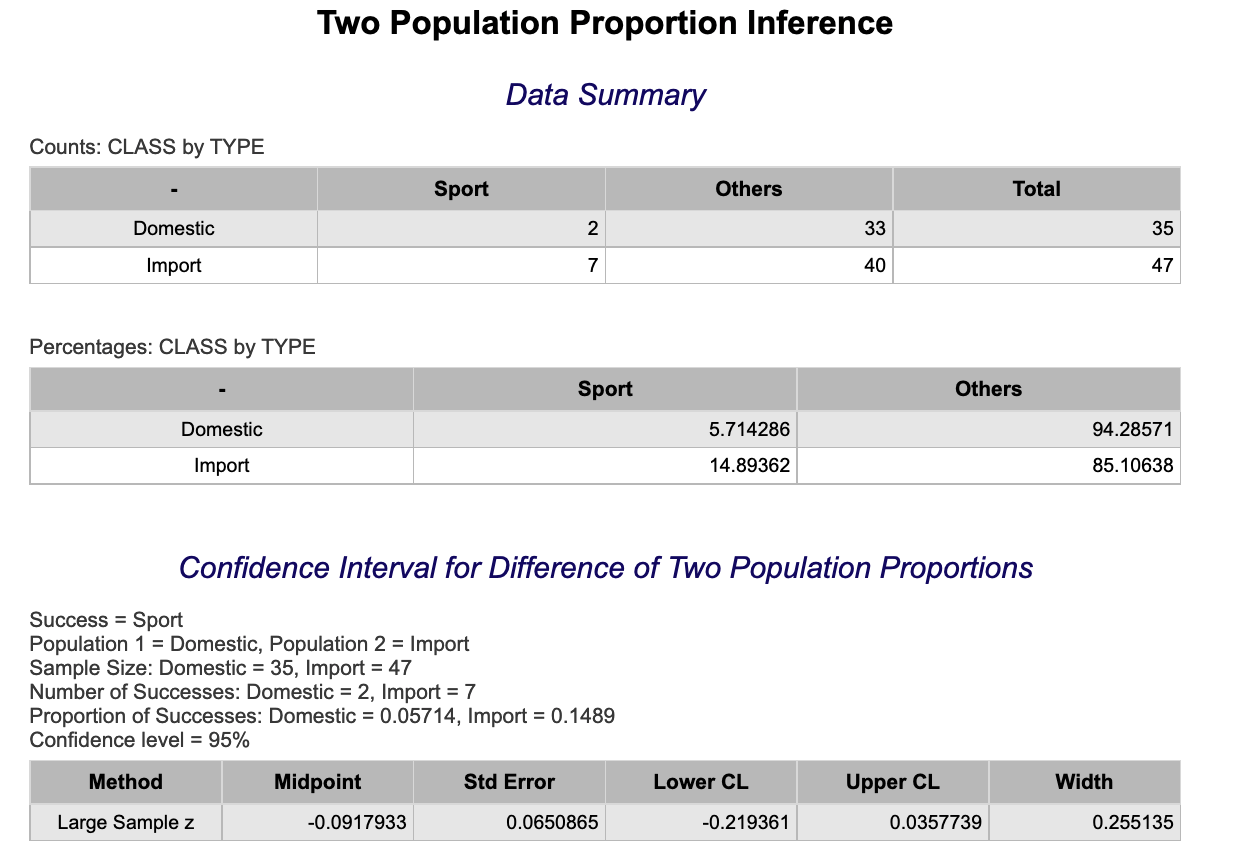
Using Summary Statistics
-
Open the Analytics toolbox on the left-hand side of the Rguroo window. Use the Analysis dropdown menu, choose the Proportion Inference option, and then select Two Populations.
-
In the Response/Success section, type in a label for the Response variable and a label for Success. Optionally, you can type in a label for Failure.
-
In the Population section, type in a label for the population variable.
-
In the Data Summary tab, for each of Population 1 and Population 2 type in the following: Label, Sample size, and # of Successes.
-
Choose the corresponding Level. Clicking on the refresh button will load the Sample Size, # of Successes, and Proportion of Success for each population.

-
Select the Confidence Interval tab, specify the Confidence Level, and check the Large Sample z checkbox.
-
Click the preview icon
to see the result.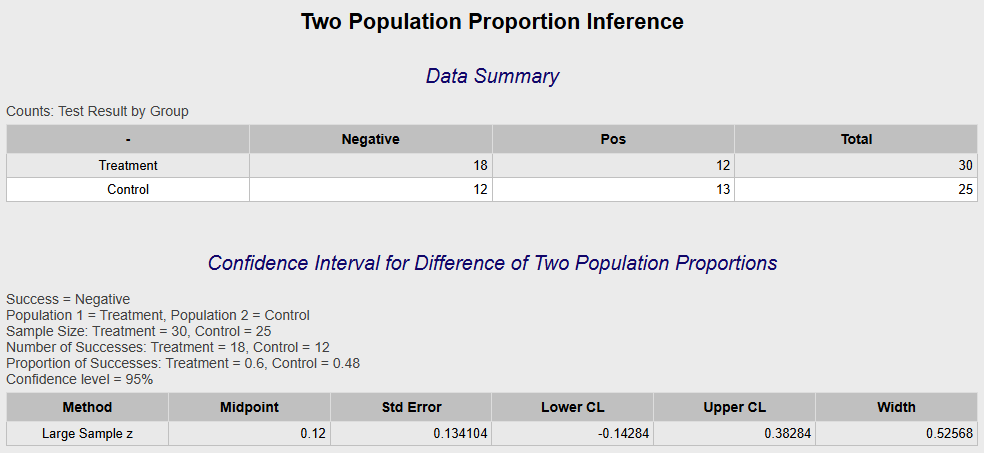
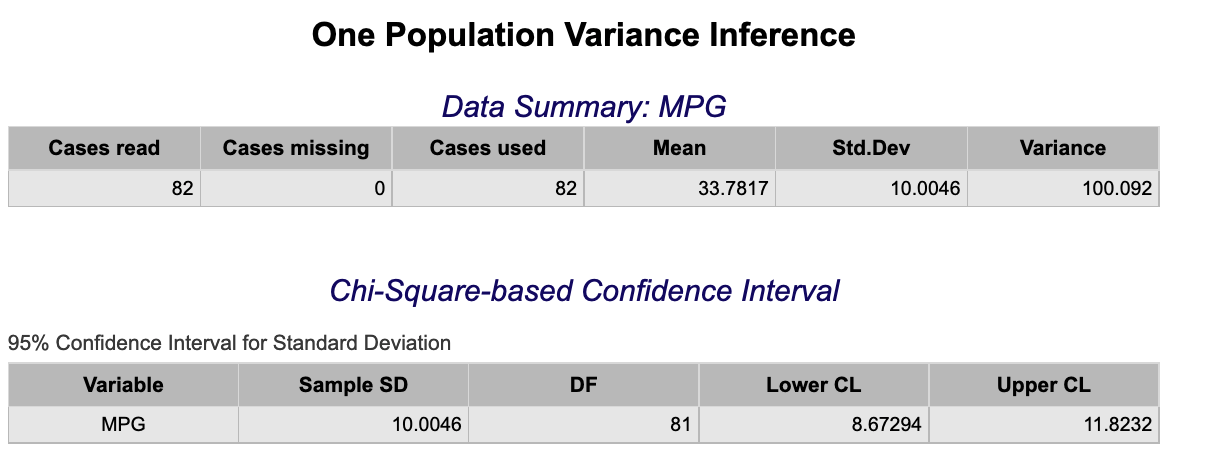
Standard Deviation and Variance
Using Raw Data
-
See Creating a Dataset to input your data or recreate the example below by Accessing the Rguroo Data Repository and using the 'cardata' dataset found in the 'Rguroo Users Guide' repository.
-
Open the Analytics toolbox on the left-hand side of the Rguroo window. Use the Analysis dropdown menu, choose the Variance Inference option, and then select One Population.
-
Select a Dataset and a Variable. The values for Sample S.d. and Sample Size will be calculated and filled in automatically.
-
For Population Parameter select σ or σ2, for confidence interval for standard deviation or variance, respectively.
-
In the Confidence Interval section, input the desired Confidence Level and check the Chi-Square checkbox.
-
Click the preview icon
to see the result.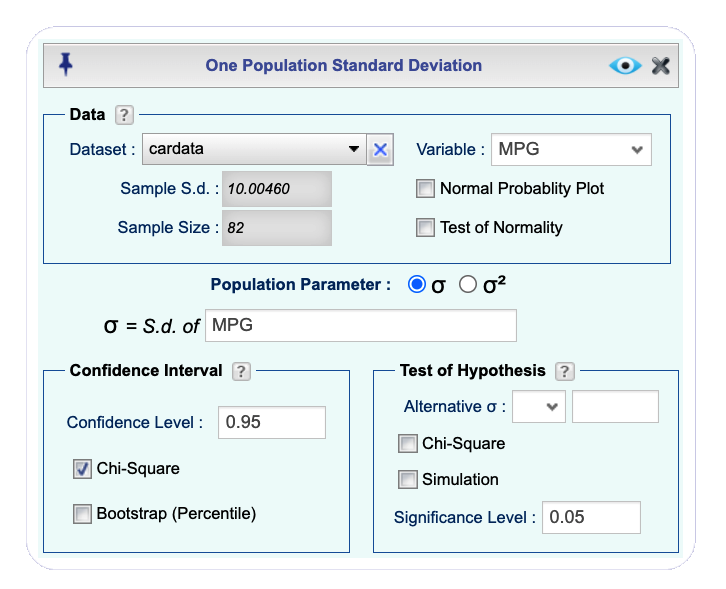
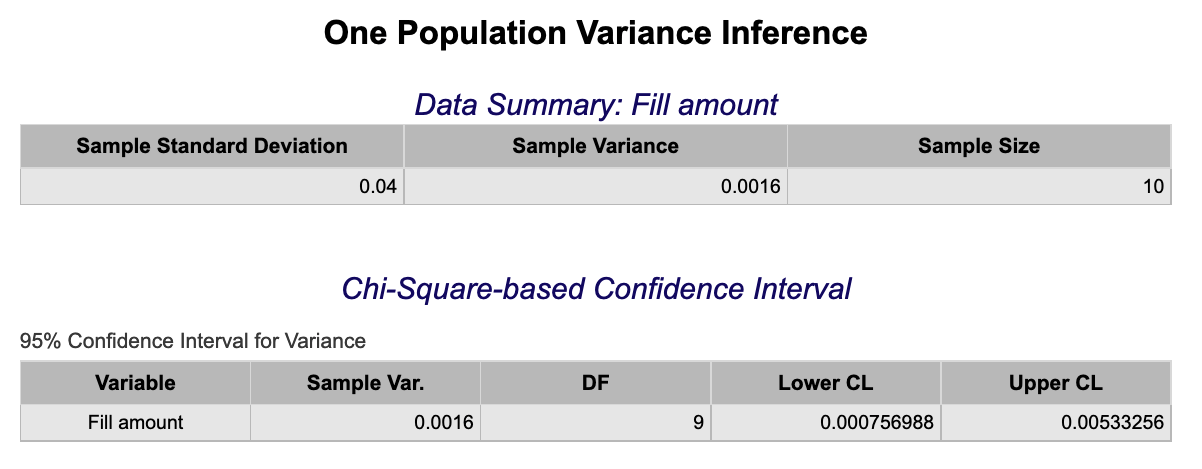
Using Summary Statistics
-
Open the Analytics toolbox on the left-hand side of the Rguroo window. Use the Analysis dropdown menu, choose the Variance Inference option, and then select One Population.
-
Enter the values for Sample S.d. and Sample Size.
-
For Population Parameter select σ or σ2, for confidence interval for standard deviation or variance, respectively.
-
Write a Variable Label for the parameter in the text box for σ = S. d. of or σ2 = Variance of.
-
In the Confidence Interval section, input the desired Confidence Level and check the Chi-Square checkbox.
-
Click the preview icon
to see the result.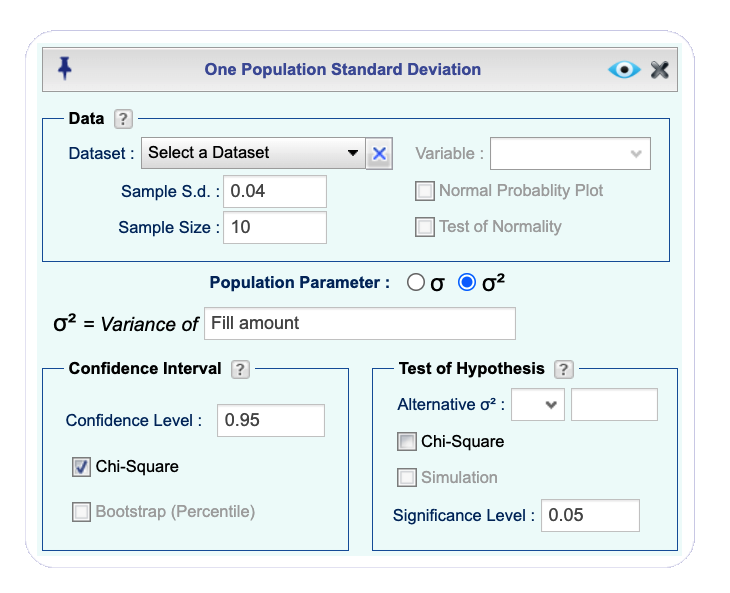
Counting
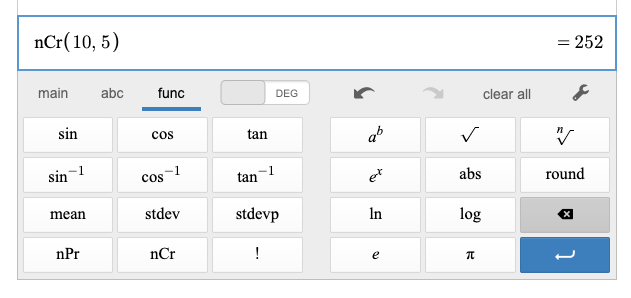
Combination
-
Open the Applets-Calculators toolbox on the left-hand side of the Rguroo window. Use the
 to expand the Calculators (Desmos) option and choose the Scientific Calculator.
 -
Select the func option to open the functions menu of the calculator.
-
Select nCr and enter the two required parameters separated by a comma, as in , where and .
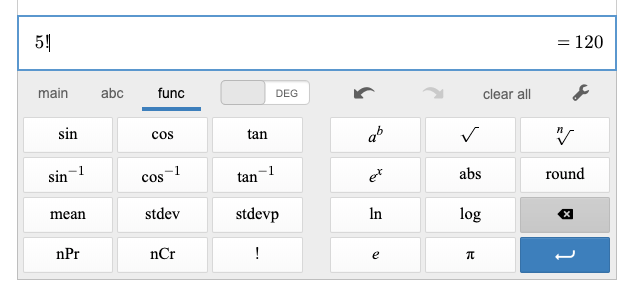
Factorial
-
Open the Applets-Calculators toolbox on the left-hand side of the Rguroo window. Use the
to expand the Calculators (Desmos) option and choose the Scientific Calculator. -
Select the func option to open the functions menu of the calculator.
-
Enter the desired number and select !.
Permutation
-
Open the Applets-Calculators toolbox on the left-hand side of the Rguroo window. Use the
to expand the Calculators (Desmos) option and choose the Scientific Calculator. -
Select the func option to open the functions menu of the calculator.
-
Select nPr and enter the two required parameters separated by a comma, as in , where and .

Data Manipulation
Filtering
-
See Creating a Dataset to input your data or recreate the example below by Accessing the Rguroo Data Repository and using the 'cardata' dataset found in the 'Rguroo Users Guide' repository.
-
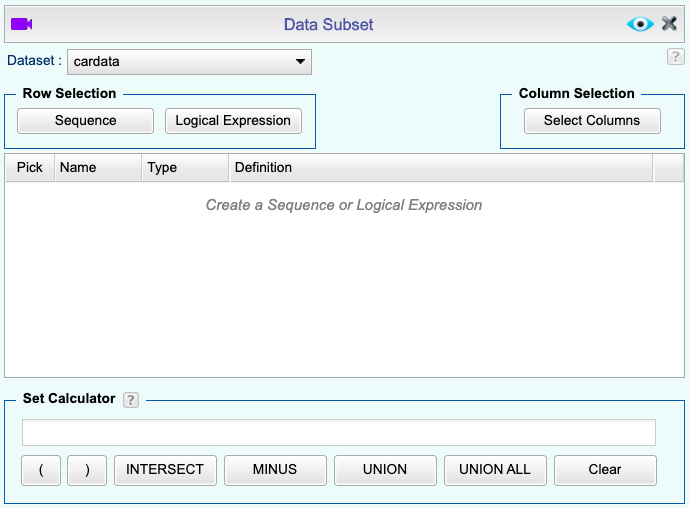
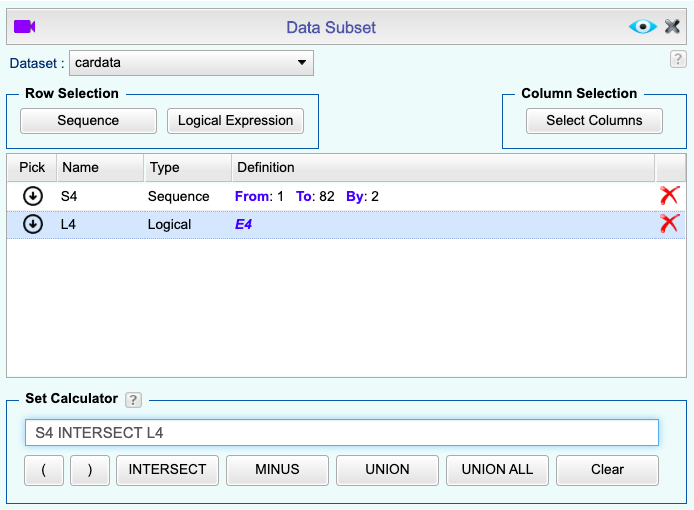
Open the Data toolbox on the left-hand side of the Rguroo window. Use the Functions dropdown menu and choose the Subset option.
-
Select a Dataset.
-
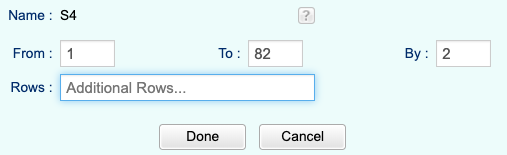
To subset Rows: select Sequence and/or Logical Expression. If using multiple criteria to subset rows, the Set Calculator is required.
-
See example below of using Sequence to subset rows.
-
See example below of using Logical Expression to subset rows. Click the green plus button
to create a Logical Expression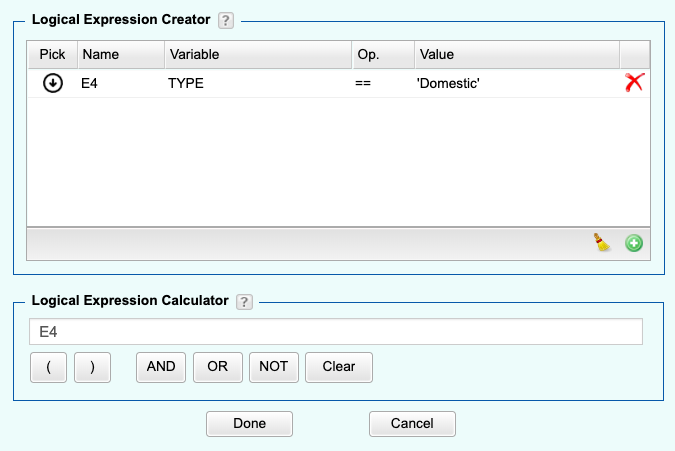
-
See example below of using Set Calculator to use multiple criteria to subset rows.
-
-
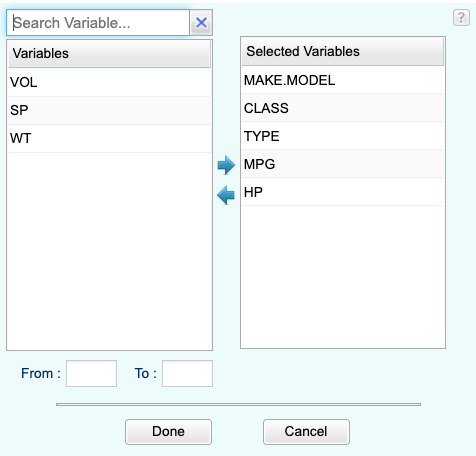
To subset Columns: select Select Columns and use the arrows or drag-and-drop to place the desired variables in the right column.
-
Click the preview icon
.
Sorting
-
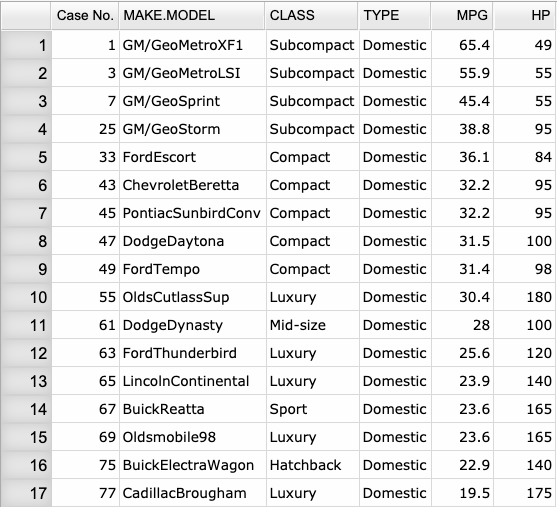
See Creating a Dataset to input your data or recreate the example below by Accessing the Rguroo Data Repository and using the 'cardata' dataset found in the 'Rguroo Users Guide' repository.
-
Open the Data toolbox on the left-hand side of the Rguroo window. Use the Functions dropdown menu and choose the Sort option.
-
Select a Dataset and use the green plus button
to add a sorting criterion, which includes a variable and a choice of ascending/descending.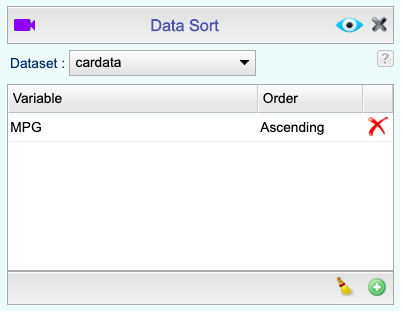
-
Click the preview icon
.
Subset Calculations
-
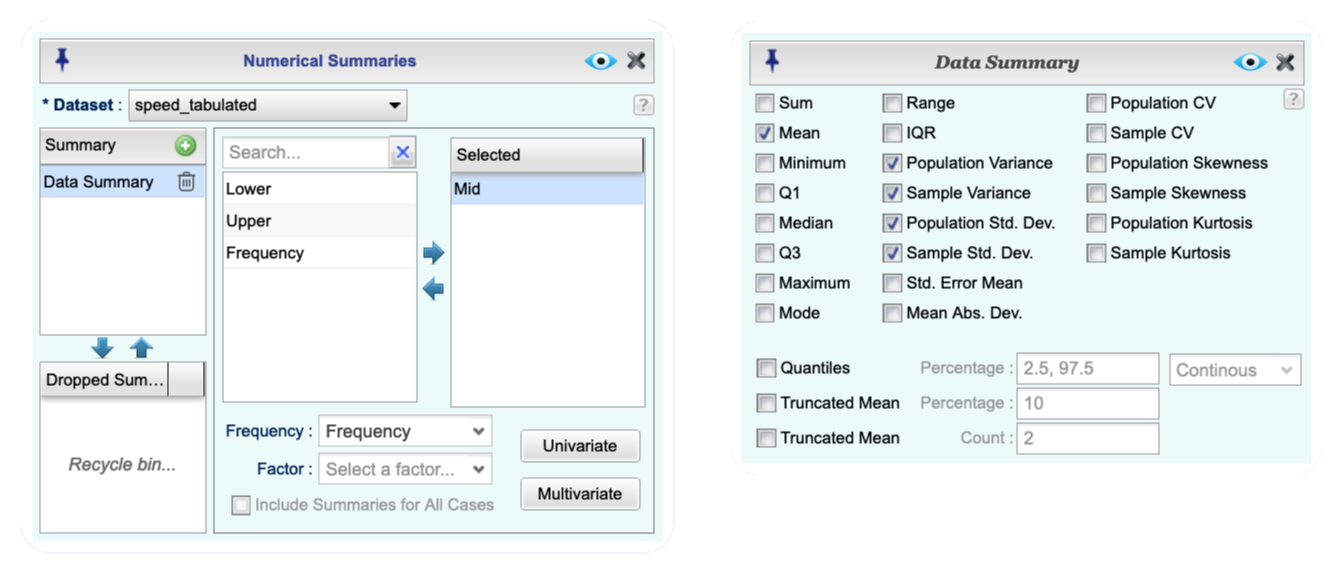
See Creating a Dataset to input your data or recreate the example below by Accessing the Rguroo Data Repository and using the 'Speed_tabulated' dataset found in the 'Rguroo Users Guide' repository.
-
Open the Analytics toolbox on the left-hand side of the Rguroo window. Use the Analysis dropdown menu and choose the Numerical Summaries option.
-
Select a Dataset, and click the green plus button
to add a summary. Move one or more numerical variable(s) to Selected column. Select a frequency variable from the Frequency dropdown. -
Click the Univariate button and select the desired summary statistic (Mean, Population Variance, Sample Variance, Population Std. Dev., and Sample Std. Dev.).
-
Click the preview icon
to see the result.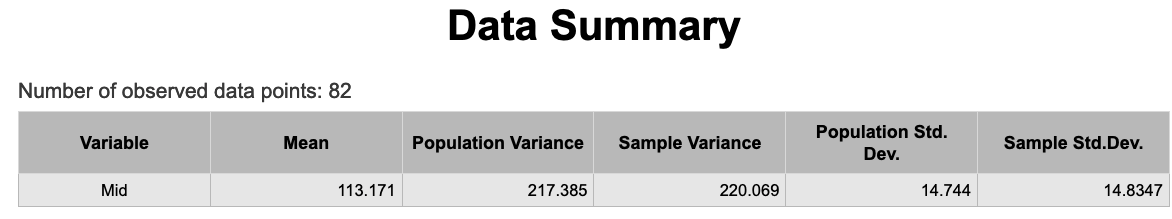
Descriptive Statistics
One Variable
Method 1: Five number summary, Trimmed Mean, Weighted Mean, Mode, Percentiles
-
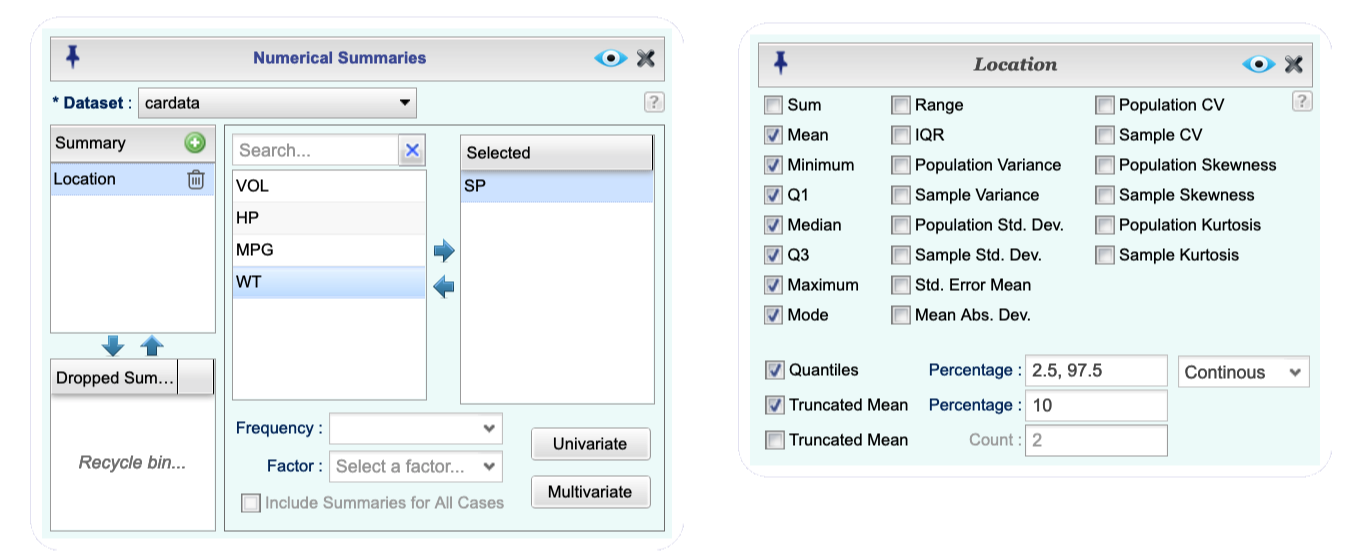
See Creating a Dataset to input your data or recreate the example below by Accessing the Rguroo Data Repository and using the 'cardata' dataset found in the 'Rguroo Users Guide' repository.
-
Open the Analytics toolbox on the left-hand side of the Rguroo window. Use the Analysis dropdown menu and choose the Numerical Summaries option.
-
-
Select a Dataset.
-
Move a variable to Selected column. If weighted mean is desired, choose the weight variable in the Frequency dropdown.
-
Click the Univariate button and select the desired summary statistics. For Trimmed Mean, select Truncated Mean, and enter percentage (or count). For percentiles check the Quantiles checkbox, and list your desired percentages, separated by commas, in the Percentage textbox.
-
-
Click the preview icon
to see the result.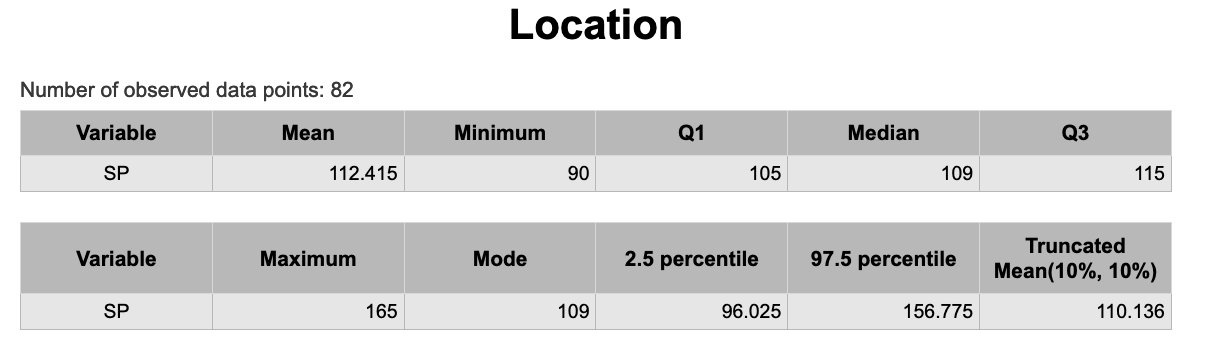
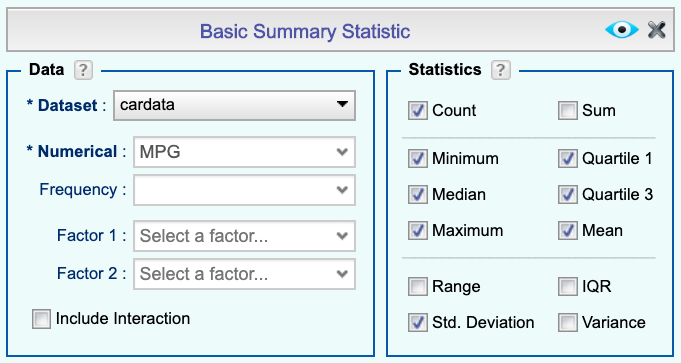
Method 2: One Variable (Mean, Median, Q1, Q3, Min, Max)
-
See Creating a Dataset to input your data or recreate the example below by Accessing the Rguroo Data Repository and using the 'cardata' dataset found in the 'Rguroo Users Guide' repository.
-
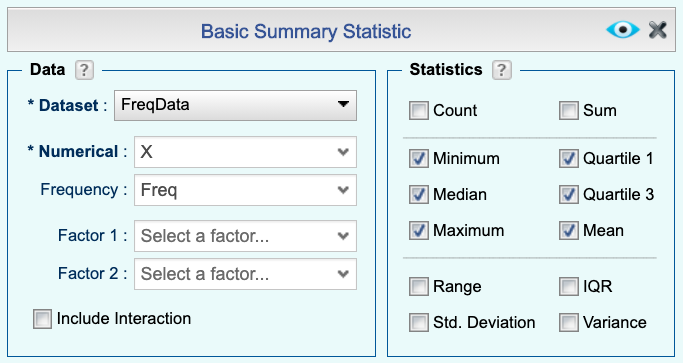
Open the Data toolbox on the left-hand side of the Rguroo window. Use the Functions dropdown menu and choose the Summary Statistic option.
-
Select a Dataset and Numerical variable. Using the checkboxes, check the statistics desired.
-
Click the preview icon
to see the result and select “All Observations” in the output.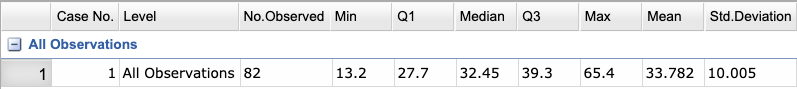
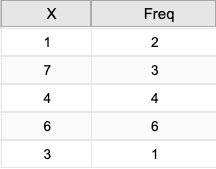
Two Variable
-
See Creating a Dataset to input your data. Here we use a dataset with two variables.
-
Open the Data toolbox on the left-hand side of the Rguroo window. Use the Functions dropdown menu and choose the Summary Statistic option.
-
Select a Dataset, Numerical variable, and Frequency variable. Using the checkboxes, check the statistics desired. The Frequency variable will be used to create weights.
-
Click the preview icon
. Choose "All Observations".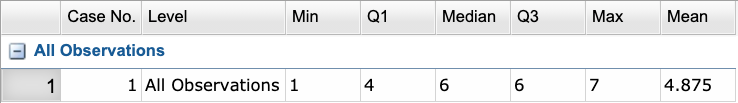
Discrete Random Variable
Expected Value
Computing Expectation and Variance for a Discrete Probability Distribution
-
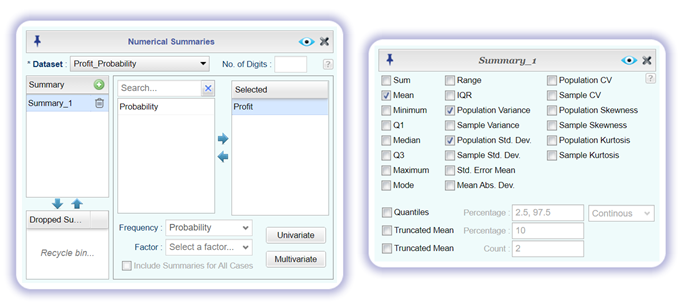
See Creating a Dataset to input your data or recreate the example below by Accessing the Rguroo Data Repository and using the 'Profit_Probability' dataset found in the 'Rguroo Users Guide' repository.
-
Open the Analytics toolbox on the left-hand side of the Rguroo window. Use the Analysis dropdown menu and choose the Numerical Summaries.
-
Select the Dataset that contains your probability distribution. Your probability distribution should have a variable of values and a variable of probabilities.
-
Move the variable consisting of values to the Selected column. This can be done by clicking on the variable and then dragging and dropping it in the appropriate column.
-
From the Frequency dropdown select the variable that contains the probabilities.
-
Click the Univariate button and select Mean, Population Variance, and Population Std. Dev.
-
Click the preview icon
to see the result. The Mean value given is the expected value of your probability distribution.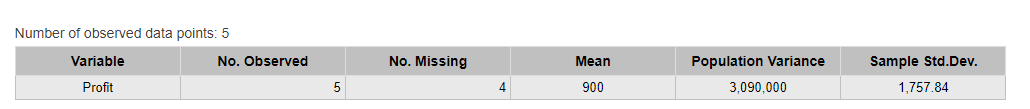
F-Distribution
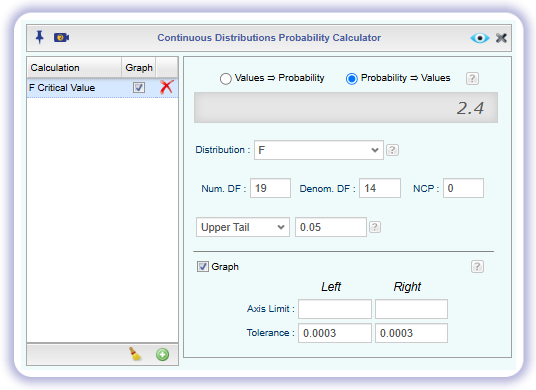
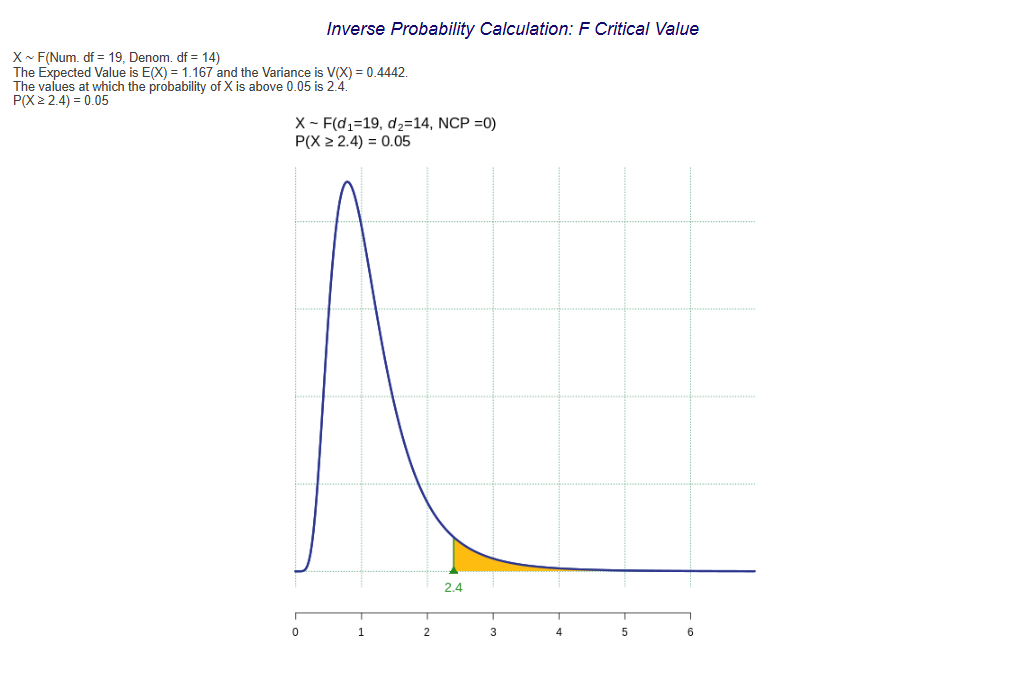
Critical Value
-
Open the Probability-Simulation toolbox on the left-hand side of the Rguroo window. Use the Probability dropdown menu, choose the Probability Calculator option, and then select Continuous.
-
Select the option Probability ⇒ Values.
-
Select F as the Distribution, enter the Numerator Degrees of Freedom (Num. DF), and enter the Denominator Degrees of Freedom (Denom. DF). Leave other parameters at default values.
-
Select the option Upper Tail from the dropdown menu, then type the desired probability in the text field.
-
Adjust the other options appropriately, including checking the Graph option and editing the Calculation Name, if desired.
-
Click the preview icon
.
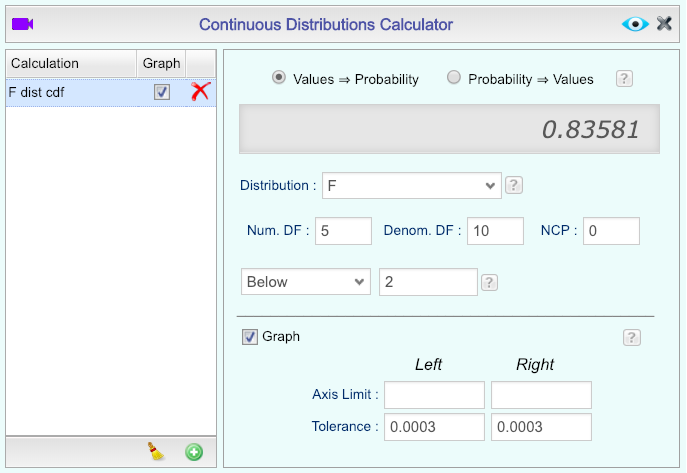
F-Probability (cdf)
-
Open the Probability-Simulation toolbox on the left-hand side of the Rguroo window. Use the Probability dropdown menu, choose the Probability Calculator option, and then select Continuous.
-
Select the option Values => Probability.
-
Select F as the Distribution, and enter the Num. DF and Denom. DF.
-
Select the option Below from the dropdown menu, then type the desired value in the text field.
-
Adjust the other options appropriately, including checking the Graph option and editing the Calculation Name, if desired.
-
Click the preview icon
. Choose "All Observations".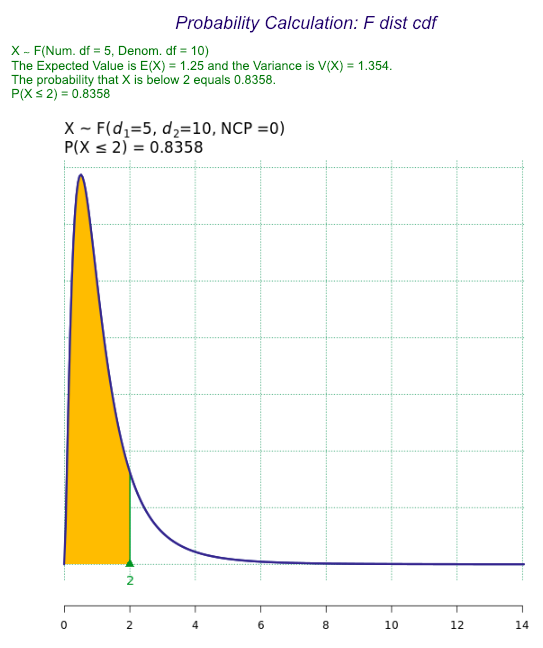
Frequency Distribution
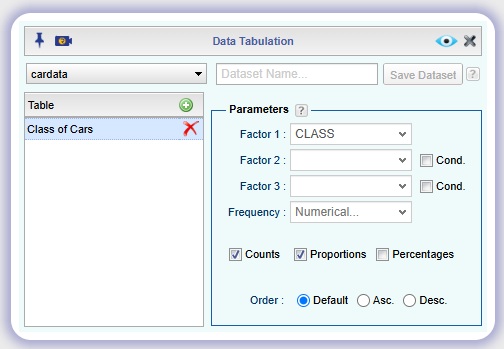
Qualitative Frequency Distribution
-
See Creating a Dataset to input your data or recreate the example below by Accessing the Rguroo Data Repository and using the 'cardata' dataset found in the 'Rguroo Users Guide' repository.
-
Open the Analytics toolbox on the left-hand side of the Rguroo window. Use the Analysis dropdown menu, choose the Tabulation option, and then select Categorical.
-
-
Select a Dataset. Type a name for your table.
-
Select the qualitative variable that you want to tabulate from the Factor 1 dropdown.
-
Select one or more of Counts, Proportions, or Percentage.
-
Select the order preference: Default, Ascending, or Descending.
-
-
Click the preview icon
to see the result.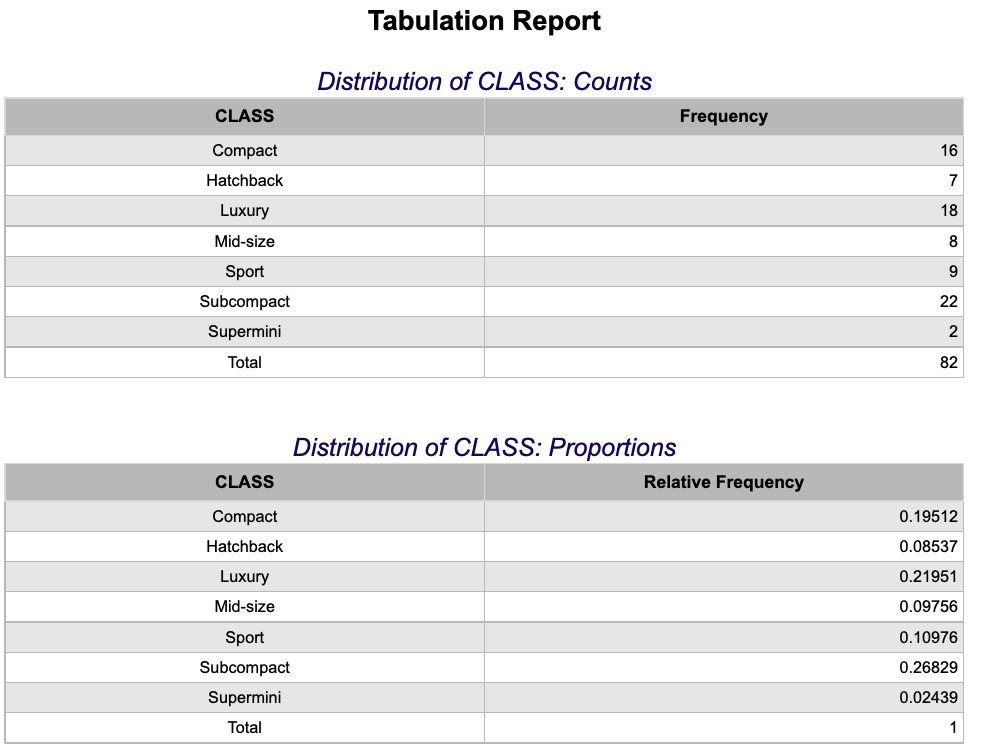
Quantitative Frequency Distribution
Creating Frequency Tables and Relative Frequency Tables for Numerical Variables
-
See Creating a Dataset to input your data or recreate the example below by Accessing the Rguroo Data Repository and using the 'cardata' dataset found in the 'Rguroo Users Guide' repository.
-
Open the Analytics toolbox on the left-hand side of the Rguroo window. Use the Analysis dropdown menu, choose the Tabulation option, and then select Numerical (Binning).
-
Select a Dataset and a numerical Variable for which you like to create a frequency table.
-
Under the Bins section select a method for binning. For the example shown, the bins start at 90 and have a width of 10.
-
Under Report select one or more of Counts, Proportions %, or Cumulative %.
Note: In the Binning column you can add more tables by clicking on the green plus button
.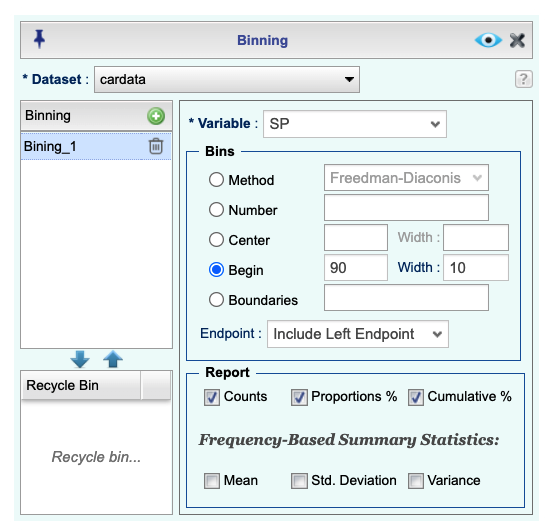
-
Click the preview icon
to see the result.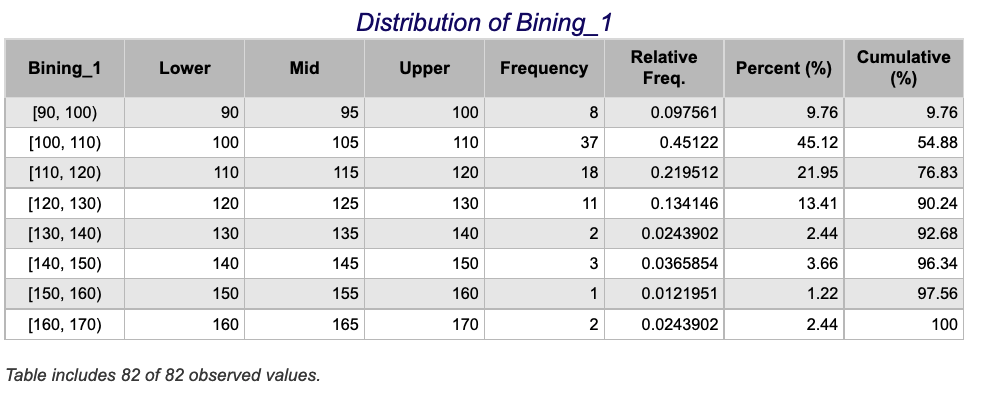
Graphs
Bar Charts
Displaying Qualitative Data Graphically
-
See Creating a Dataset to input your data or recreate the example below by Accessing the Rguroo Data Repository and using the 'cardata' dataset found in the 'Rguroo Users Guide' repository.
-
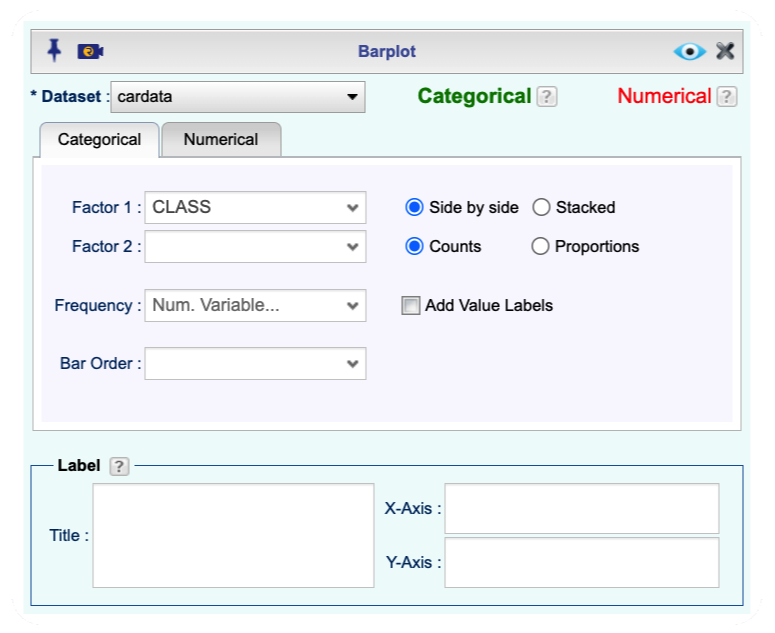
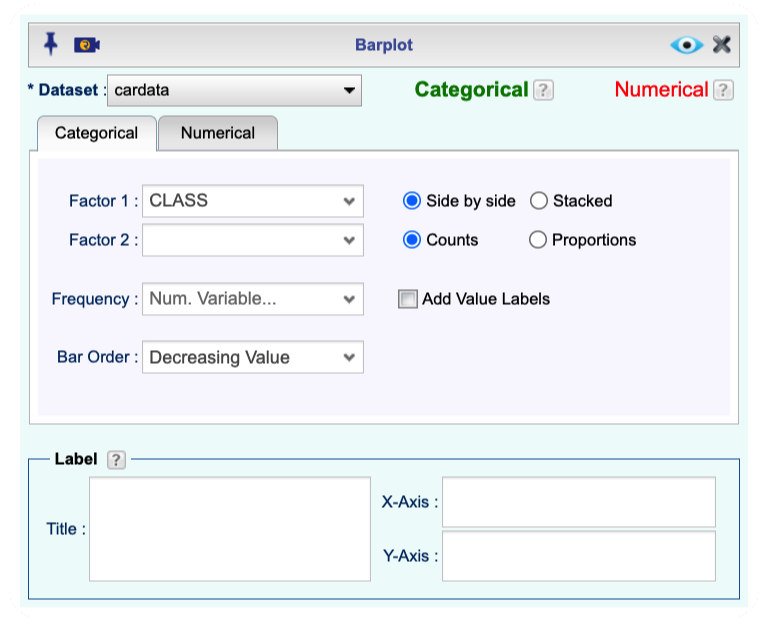
Open the Plots toolbox on the left-hand side of the Rguroo window. Use the Create Plot dropdown menu and choose the Barplot option. The Barplot dialog opens.
-
Select a Dataset. To create a barplot with categories across the x-axis, click the Categorical tab (this is the default tab).
-
Select a Factor 1 variable, adjust the other options appropriately, and add a title. If your data is in the form of a frequency table in the Frequency dropdown select the name of the column that consists of frequencies.
-
Click the preview icon
to see the result.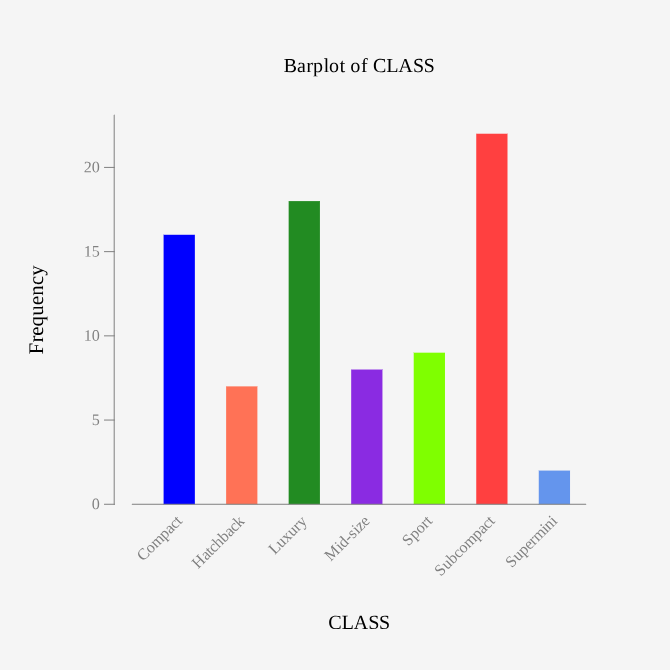
Box Plot
-
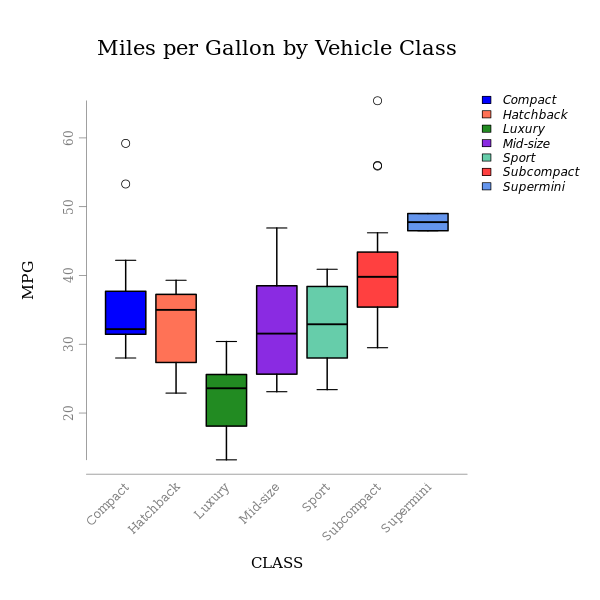
See Creating a Dataset to input your data or recreate the example below by Accessing the Rguroo Data Repository and using the 'cardata' dataset found in the 'Rguroo Users Guide' repository.
-
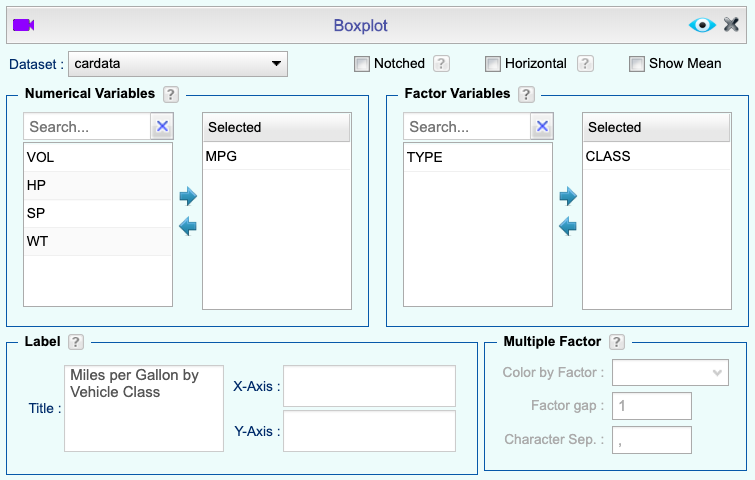
Open the Plots toolbox on the left-hand side of the Rguroo window. Use the Create Plot dropdown menu and choose the Boxplot option.
-
Select a Dataset, Numerical variable, and Factor variable. Adjust the other options appropriately and add a title.
-
Click the preview icon
.
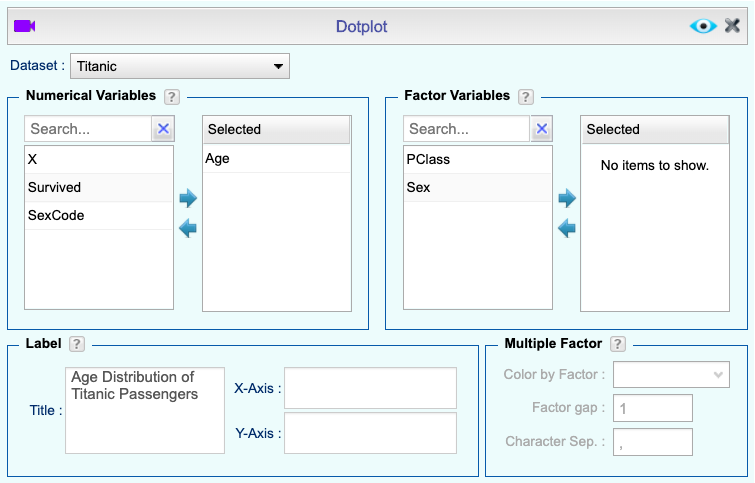
Dot Plots
-
See Creating a Dataset to input your data or recreate the example below by Accessing the Rguroo Data Repository and using the 'Titanic' dataset found in the 'R datasets' repository.
-
Open the Plots toolbox on the left-hand side of the Rguroo window. Use the Create Plot dropdown menu and choose the Dotplot option.
-
Select a Dataset and Numerical variable. Adjust the other options appropriately and add a title.
-
Click the preview icon
.
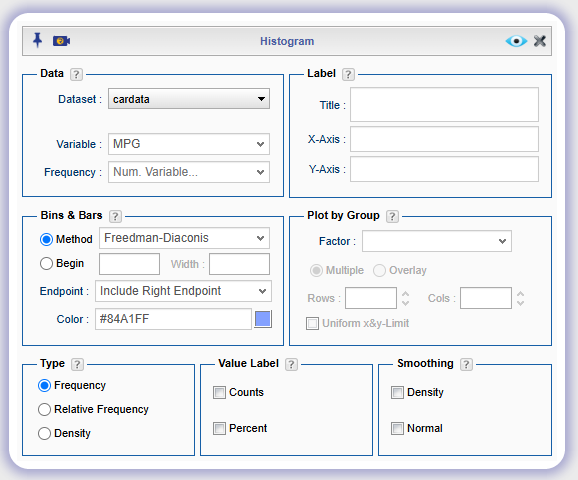
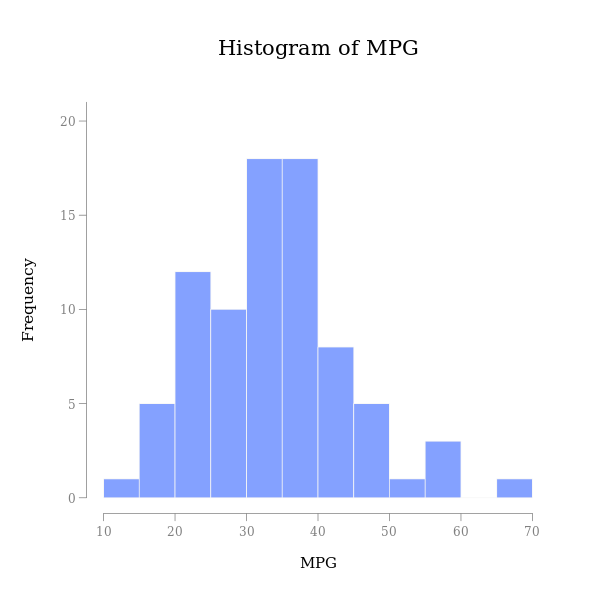
Histograms
-
See Creating a Dataset to input your data or recreate the example below by Accessing the Rguroo Data Repository and using the 'cardata' dataset found in the 'Rguroo Users Guide' repository.
-
Open the Plots toolbox on the left-hand side of the Rguroo window. Use the Create Plot dropdown menu and choose the Histogram option.
-
Select a Dataset and Variable. Adjust the other options appropriately and add a title.
-
Click the preview icon
.
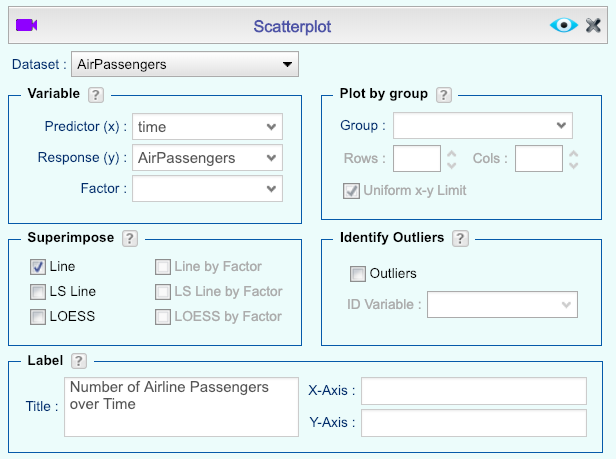
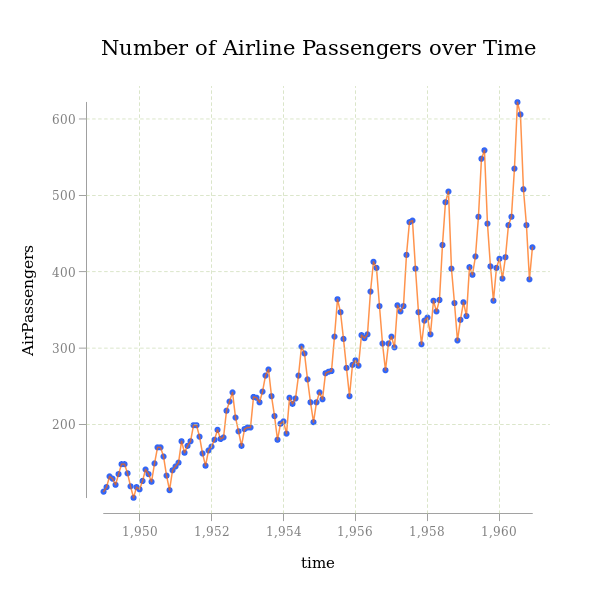
Line Graph
-
See Creating a Dataset to input your data or recreate the example below by Accessing the Rguroo Data Repository and using the 'AirPassengers' dataset found in the 'R datasets' repository.
-
Open the Plots toolbox on the left-hand side of the Rguroo window. Use the Create Plot dropdown menu and choose the Scatterplot option.
-
Select a Dataset, Predictor Variable, and Response Variable. Adjust the other options appropriately and add a title.
-
Check the Line checkbox found in the Superimpose section.
-
Click the preview icon
.
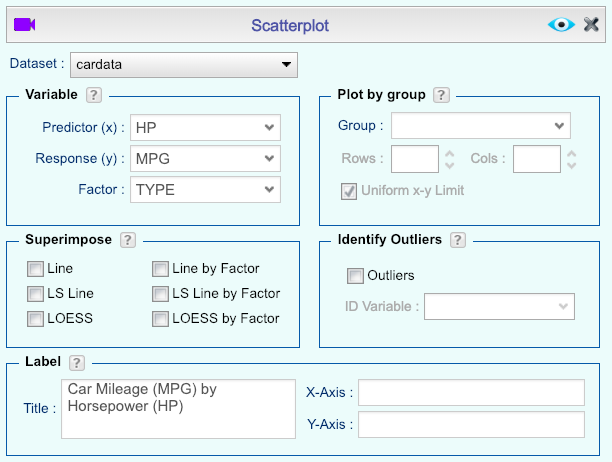
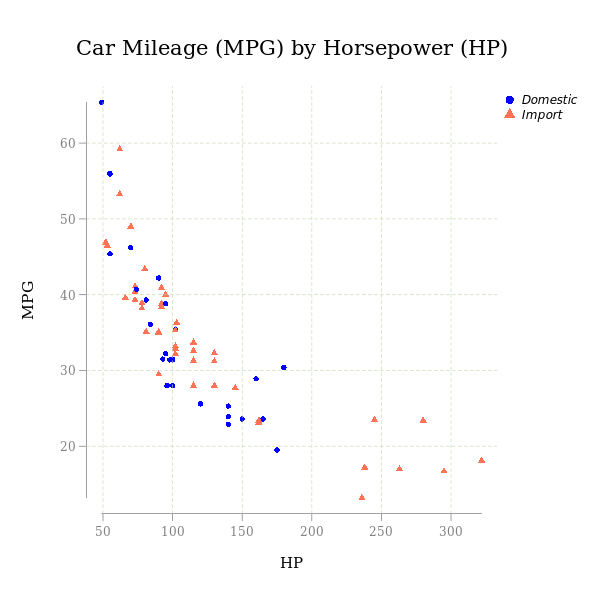
Multivariate/Multidimensional
-
See Creating a Dataset to input your data or recreate the example below by Accessing the Rguroo Data Repository and using the 'cardata' dataset found in the 'Rguroo Users Guide' repository.
-
Open the Plots toolbox on the left-hand side of the Rguroo window. Use the Create Plot dropdown menu and choose the Scatterplot option.
-
Select a Dataset, Predictor Variable, and Response Variable.
-
Select a Factor Variable which will be used to color the points. Adjust the other options appropriately and add a title.
-
Click the preview icon
.
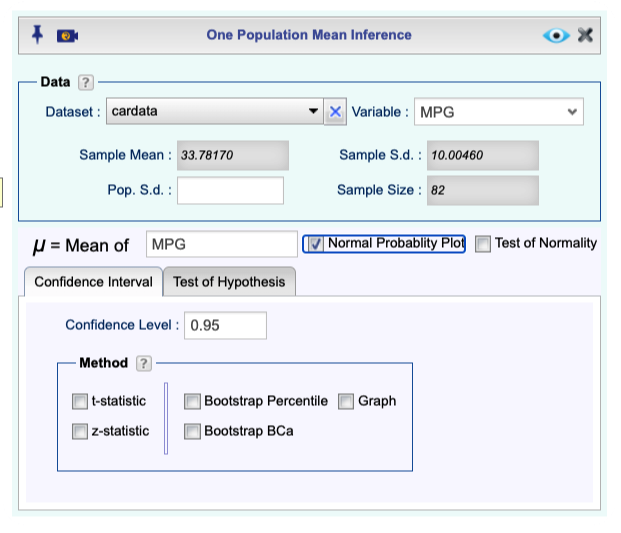
Normal Probability Plot
-
See Creating a Dataset to input your data or recreate the example below by Accessing the Rguroo Data Repository and using the 'cardata' dataset found in the 'Rguroo Users Guide' repository.
-
Open the Analytics toolbox on the left-hand side of the Rguroo window. Use the Analysis dropdown menu, choose the Mean Inference option, and then select One Population.
-
Select a Dataset and select a Variable.
-
Check the Normal Probability Plot checkbox.
-
Click the preview icon
to see the result.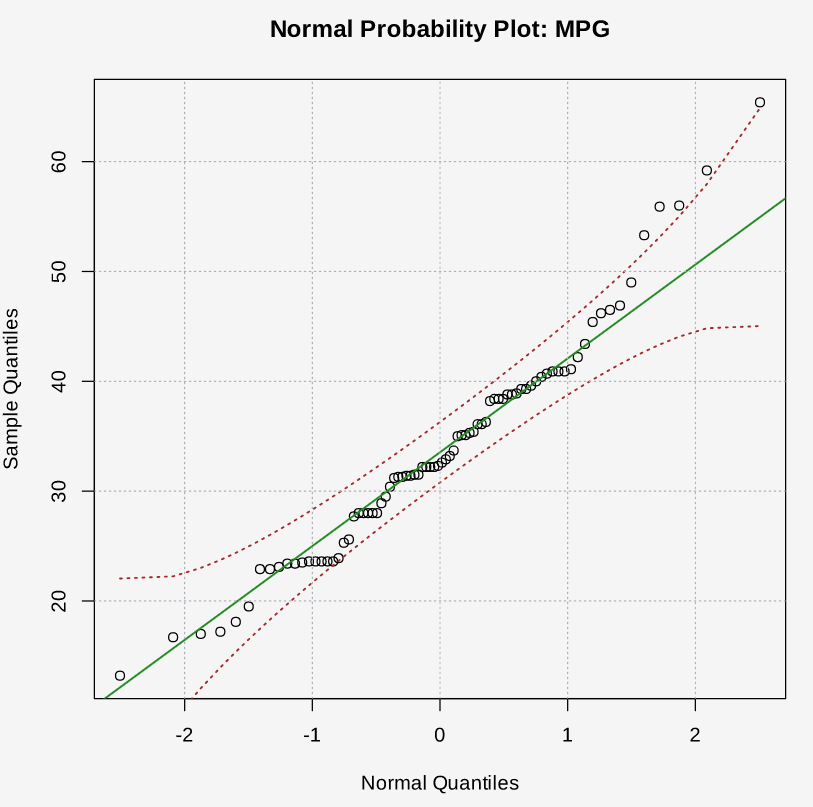
Pareto Chart
-
See Creating a Dataset to input your data or recreate the example below by Accessing the Rguroo Data Repository and using the 'cardata' dataset found in the 'Rguroo Users Guide' repository.
-
Open the Plots toolbox on the left-hand side of the Rguroo window. Use the Create Plot dropdown menu and choose the Barplot option. The Barplot dialog opens.
-
Select a Dataset. To create a barplot with categories across the x-axis, click the Categorical tab (this is the default tab).
-
Select a Factor 1 variable, adjust the other options appropriately, and add a title. If your data is in the form of a frequency table in the Frequency dropdown select the name of the column that consists of frequencies. In the Bar Order dropdown, select Decreasing Value.
-
Click the preview icon
to see the results.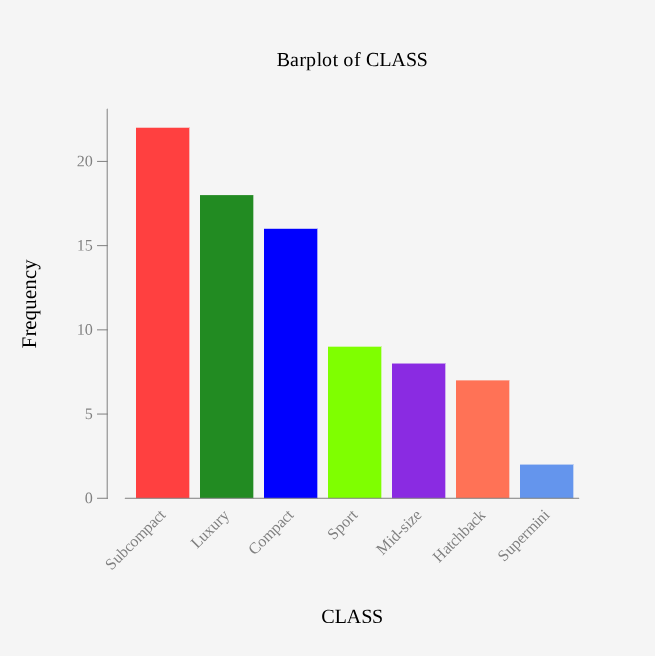
Pie Chart
-
See Creating a Dataset to input your data or recreate the example below by Accessing the Rguroo Data Repository and using the 'cardata' dataset found in the 'Rguroo Users Guide' repository.
-
Open the Plots toolbox on the left-hand side of the Rguroo window. Use the Create Plot dropdown menu and choose the Pie Chart option.
-
Select a Dataset and Factor variable. Adjust the other options appropriately and add a title.
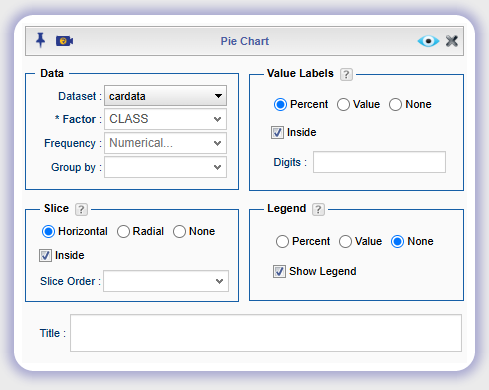
-
Click the preview icon
.
Scatterplot
-
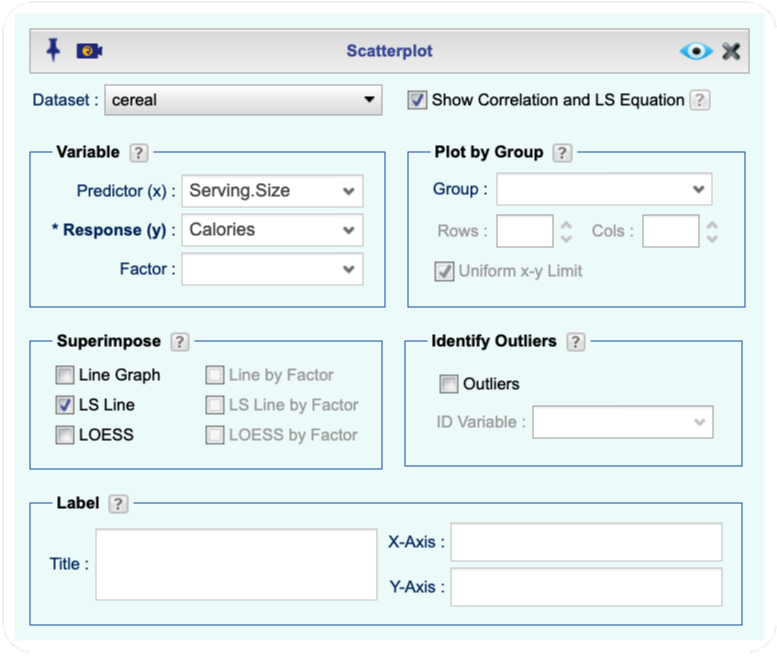
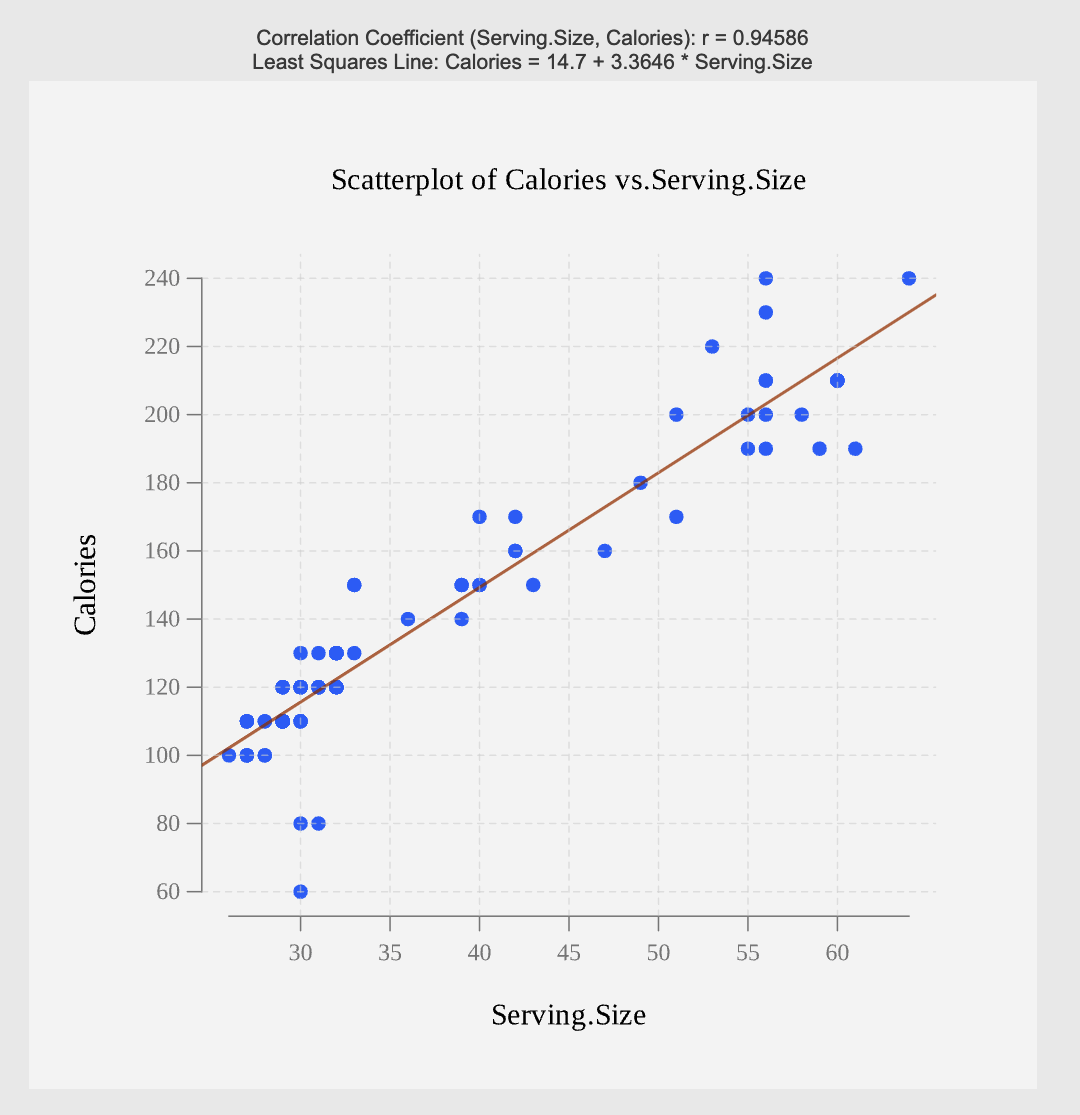
See Creating a Dataset to input your data or recreate the example below by Accessing the Rguroo Data Repository and using the 'cereal' dataset found in the 'Rguroo Users Guide' repository.
-
Open the Plots toolbox on the left-hand side of the Rguroo window. Use the Create Plot dropdown menu and choose the Scatterplot option.
-
Select a Dataset and check Show Correlation and LS Equation checkbox.
-
In the Variable section, select Predictor (x) and Response (y) variables.
-
(Optional) If you would like to see the least squares line and its equation in the Superimpose section, check the LS line checkbox.
-
Click the preview icon
.
Side-by-Side Bar Charts
-
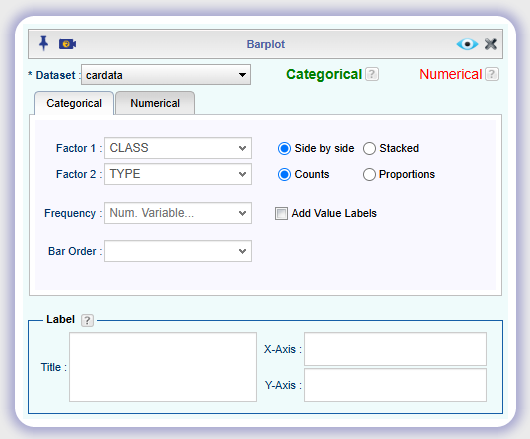
See Creating a Dataset to input your data or recreate the example below by Accessing the Rguroo Data Repository and using the 'cardata' dataset found in the 'Rguroo Users Guide' repository.
-
Open the Plots toolbox on the left-hand side of the Rguroo window. Use the Create Plot dropdown menu and choose the Barplot option.
-
Select a Dataset. To create a barplot with categories across the x-axis, click the Categorical tab (this is the default tab).
-
Select Factor 1 and Factor 2 variables and select the Side by Side option. Adjust the other options appropriately. If your data is in the form of a frequency table in the Frequency dropdown select the name of the column that consists of frequencies.
-
Click the preview icon
to see the result.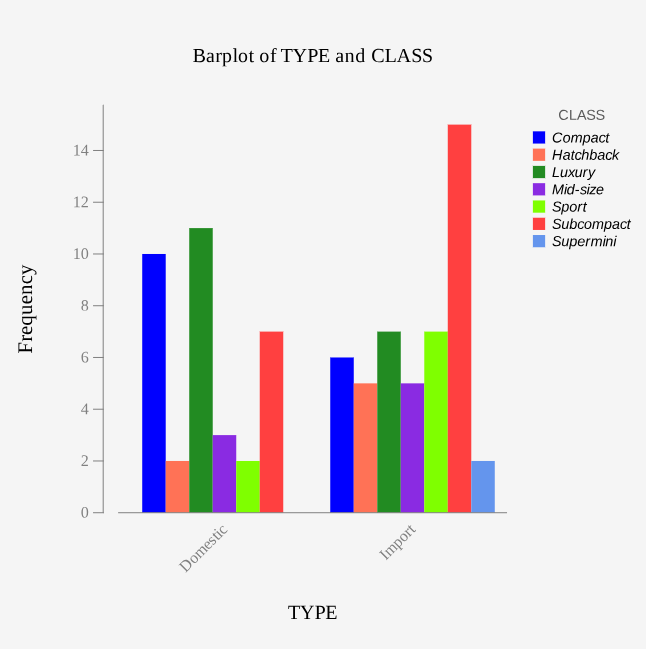
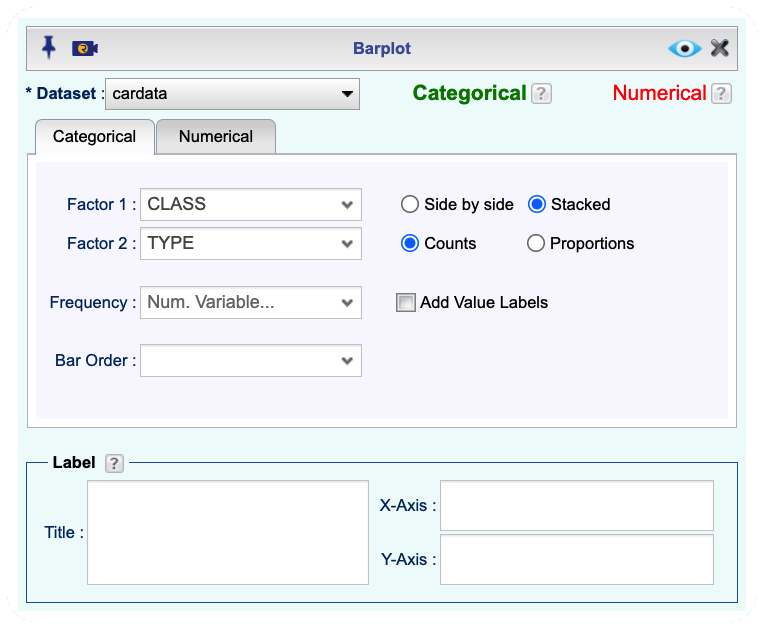
Stacked Bar Charts
-
See Creating a Dataset to input your data or recreate the example below by Accessing the Rguroo Data Repository and using the 'cardata' dataset found in the 'Rguroo Users Guide' repository.
-
Open the Plots toolbox on the left-hand side of the Rguroo window. Use the Create Plot dropdown menu and choose the Barplot option.
-
Select a Dataset. To create a barplot with categories across the x-axis, click the Categorical tab (this is the default tab).
-
Select Factor 1 and Factor 2 variables and select the Stacked option. Adjust the other options appropriately. If your data is in the form of a frequency table in the Frequency dropdown select the name of the column that consists of frequencies.
-
Click the preview icon
to see the result.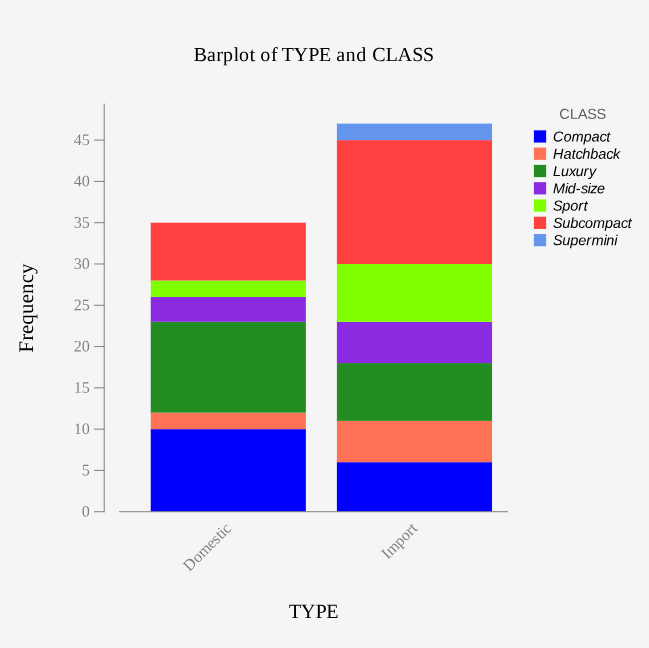
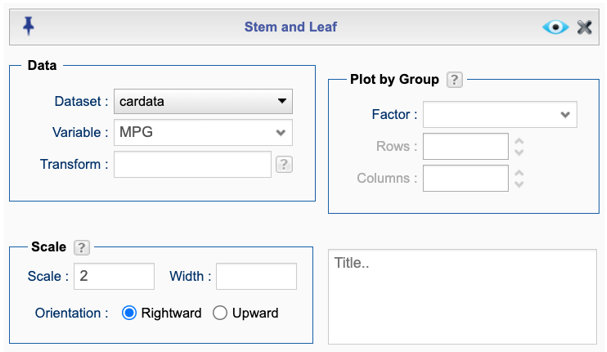
Stem and Leaf Plots
-
See Creating a Dataset to input your data or recreate the example below by Accessing the Rguroo Data Repository and using the 'cardata' dataset found in the 'Rguroo Users Guide' repository.
-
Open the Plots toolbox on the left-hand side of the Rguroo window. Use the Create Plot dropdown menu and choose the Stem and Leaf option.
-
Select a Dataset and Variable.
-
(Optional) Enter a value for Scale and adjust the other options appropriately.
-
Click the preview icon
to see the result.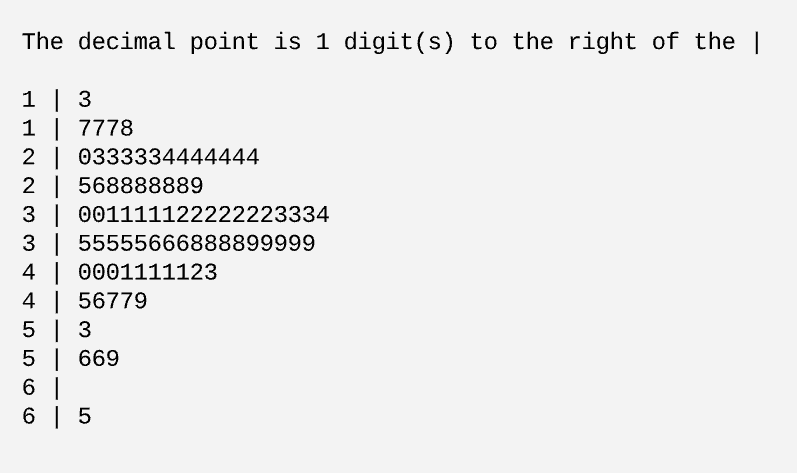
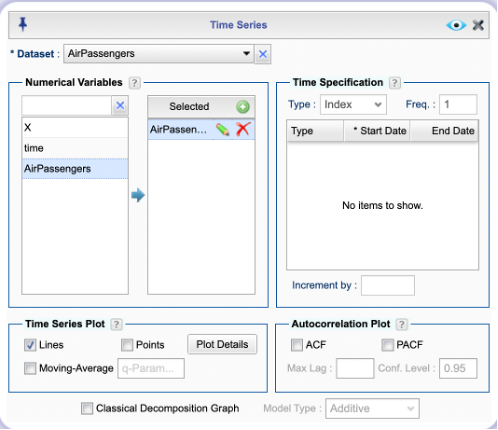
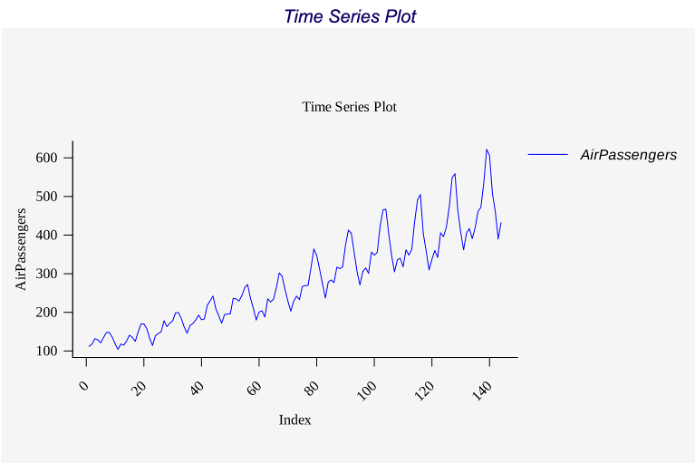
Time Series Plot
-
See Creating a Dataset to input your data or recreate the example below by Accessing the Rguroo Data Repository and using the 'AirPassengers' dataset found in the 'R datasets' repository.
-
Open the Analytics toolbox on the left-hand side of the Rguroo window. Use the Analysis dropdown menu and choose the Time Series option.
-
Select a dataset from the Dataset dropdown menu.
-
Under Numerical Variables, drag-and-drop a variable into the Selected column.
-
In the bottom left under Time Series Plot, check the Lines checkbox.
-
Click the preview icon
.
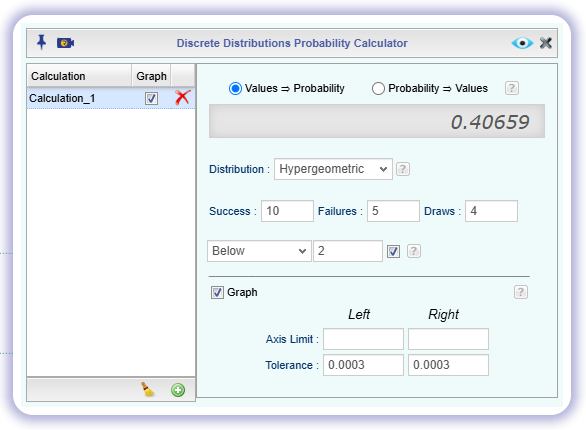
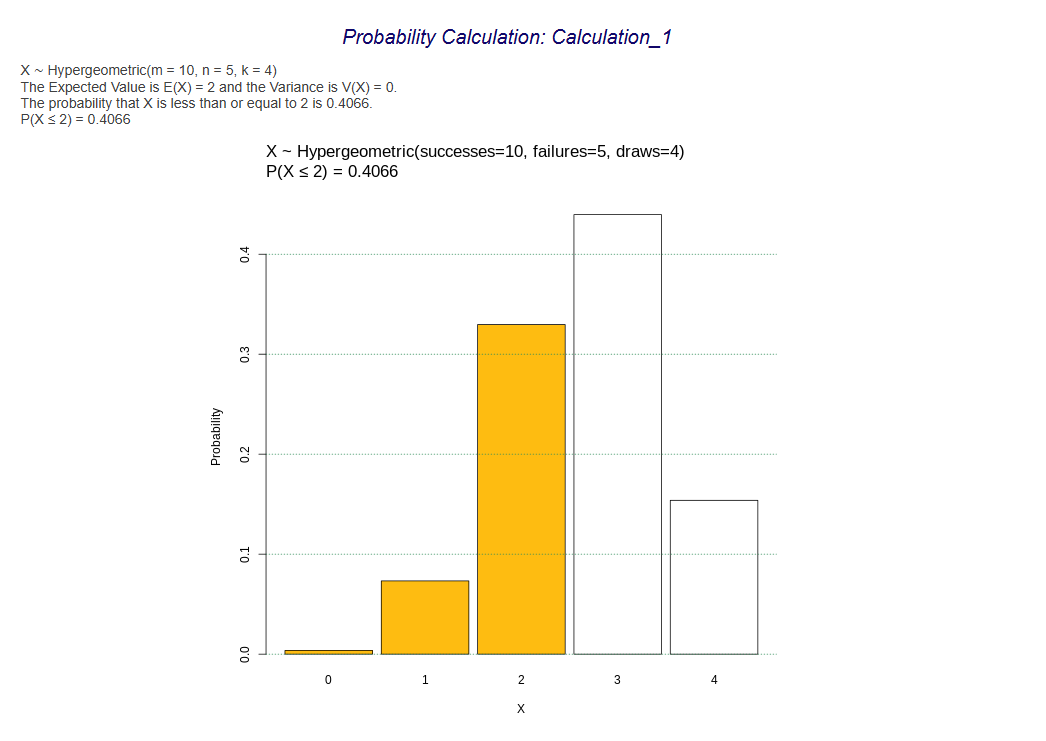
Hypergeometric Distribution
Hypergeometric Distribution
-
Open the Probability-Simulation toolbox on the left-hand side of the Rguroo window. Use the Probability dropdown menu, choose the Probability Calculator option, and then select Discrete.
-
Select the option Values ⇒ Probability.
-
Select Hypergeometric as the Distribution, and enter number of Successes, number of Failures and number of Draws.
-
Select one of the options Equal, Below, Above, Between from the dropdown menu, then type the Number of Successes in the text field.
-
Adjust the other options appropriately, including checking the Graph option and editing the Calculation Name (in the left window), if desired.
-
Click the preview icon
.
Hypothesis Testing
Standard Deviation and Variance
Using Raw Data
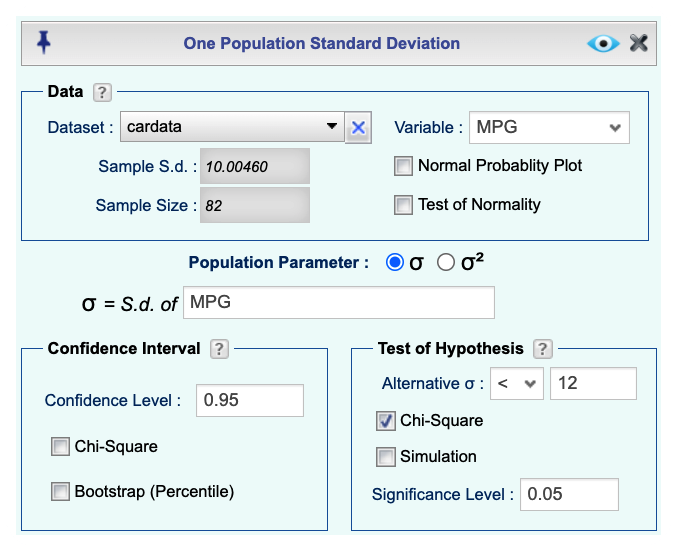
-
See Creating a Dataset to input your data or recreate the example below by Accessing the Rguroo Data Repository and using the 'cardata' dataset found in the 'Rguroo Users Guide' repository.
-
Open the Analytics toolbox on the left-hand side of the Rguroo window. Use the Analysis dropdown menu, choose the Variance Inference option, and then select One Population.
-
Select a Dataset and a Variable.
-
For Population Parameter select σ or σ2, for testing a hypothesis about a standard deviation or variance, respectively.
-
In the Test of Hypothesis section
-
Input the alternative hypothesis by selecting one of <, >, != and entering a value for the Alternative hypothesis.
-
Check the Chi-Square checkbox.
-
Enter the Significance Level.
-
-
Click the preview icon
to see the result.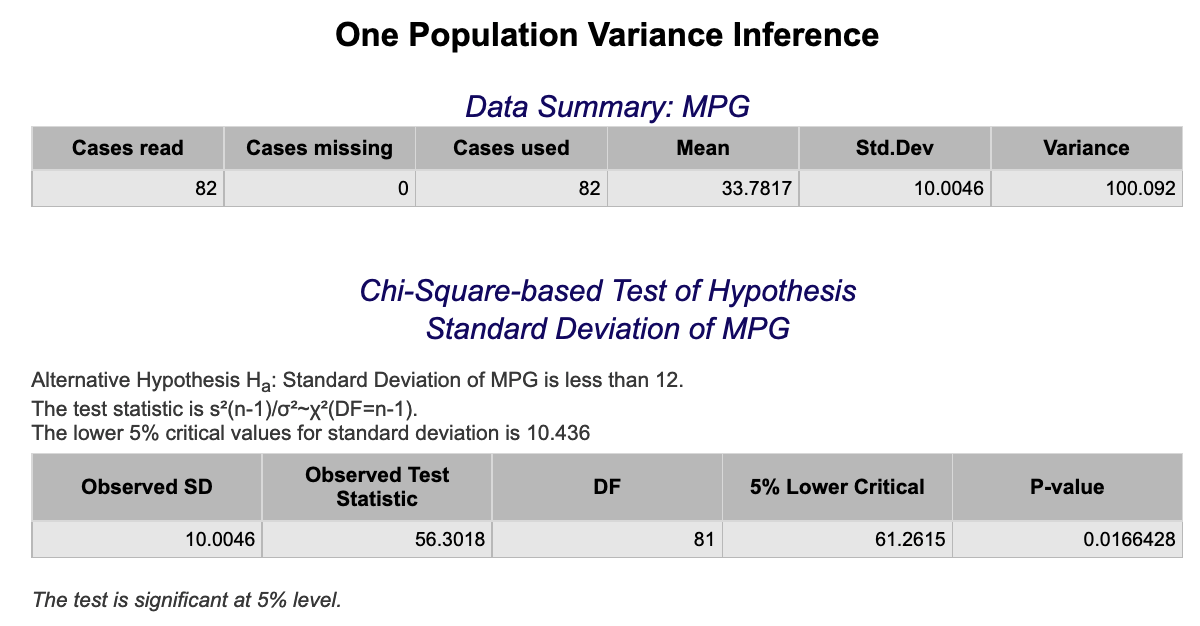
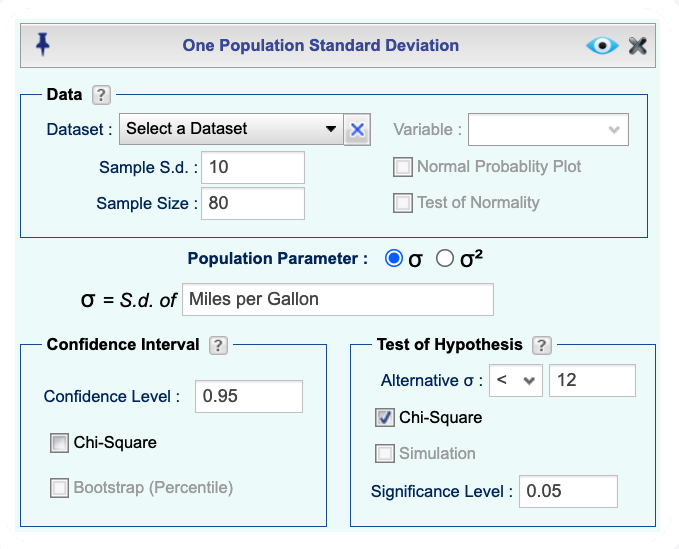
Using Summary Statistics
-
Open the Analytics toolbox on the left-hand side of the Rguroo window. Use the Analysis dropdown menu, choose the Variance Inference option, and then select One Population.
-
Enter the values for Sample S.d. and Sample Size.
-
For Population Parameter select σ or σ2, for hypothesis testing about a standard deviation or variance, respectively.
-
Write a Variable Label for the parameter in the text box for σ = S. d. of or σ2 = Variance of.
-
In the Test of Hypothesis section
-
Input the alternative hypothesis by selecting one of <, >, != and entering a value for the Alternative hypothesis.
-
Check the Chi-Square checkbox.
-
Enter the Significance Level.
-
-
Click the preview icon
to see the result.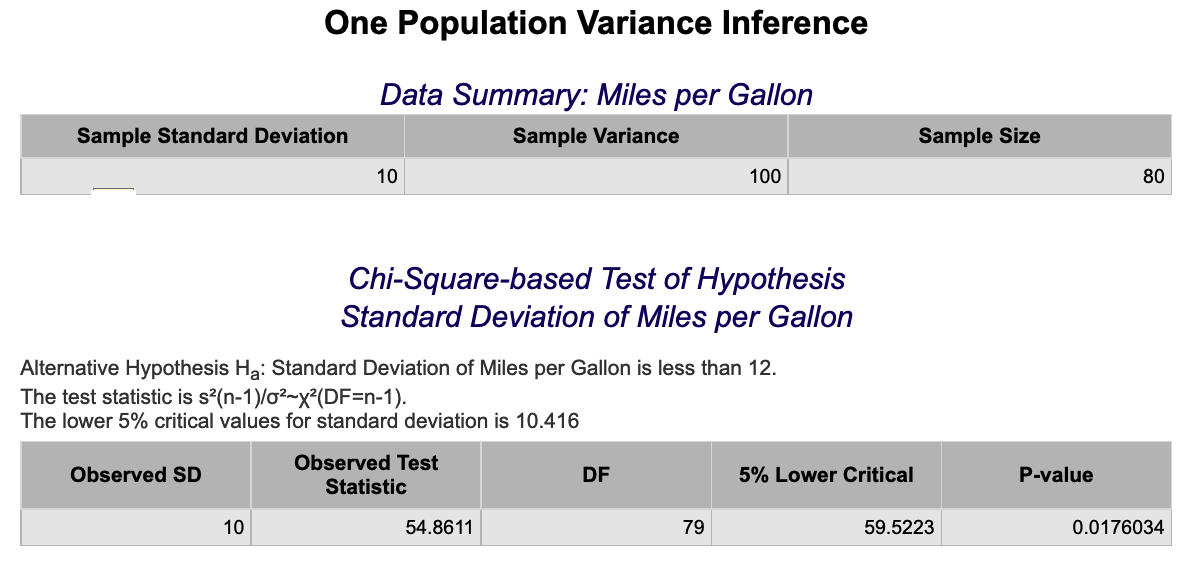
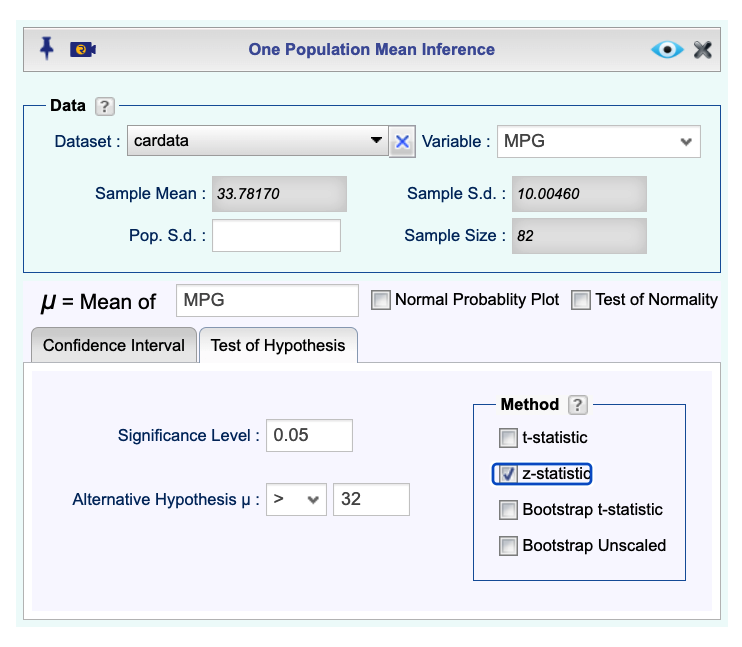
z-Test
Using raw data:
-
See Creating a Dataset to input your data or recreate the example below by Accessing the Rguroo Data Repository and using the 'cardata' dataset found in the 'Rguroo Users Guide' repository.
-
Open the Analytics toolbox on the left-hand side of the Rguroo window. Use the Analysis dropdown menu, choose the Mean Inference option, and then select One Population.
-
Select a Dataset and a Variable. The sample statistics will automatically populate.
-
Click the Test of Hypothesis tab and
-
Type in Significance Level.
-
Input the alternative hypothesis by selecting one of <, >, != and entering a value for the Alternative hypothesis.
-
Check the z-statistic checkbox.
-
-
Click the preview icon
to see the result.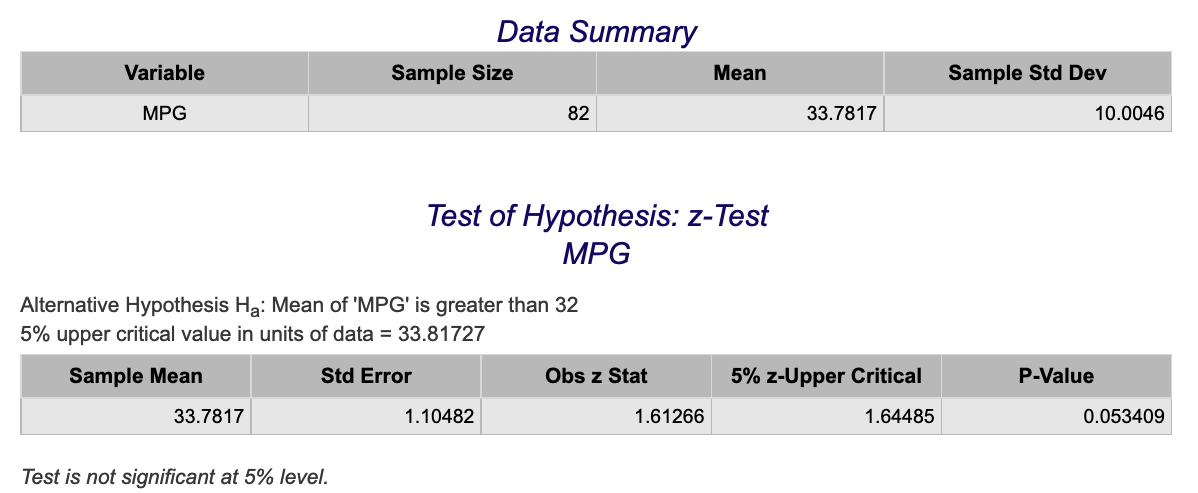
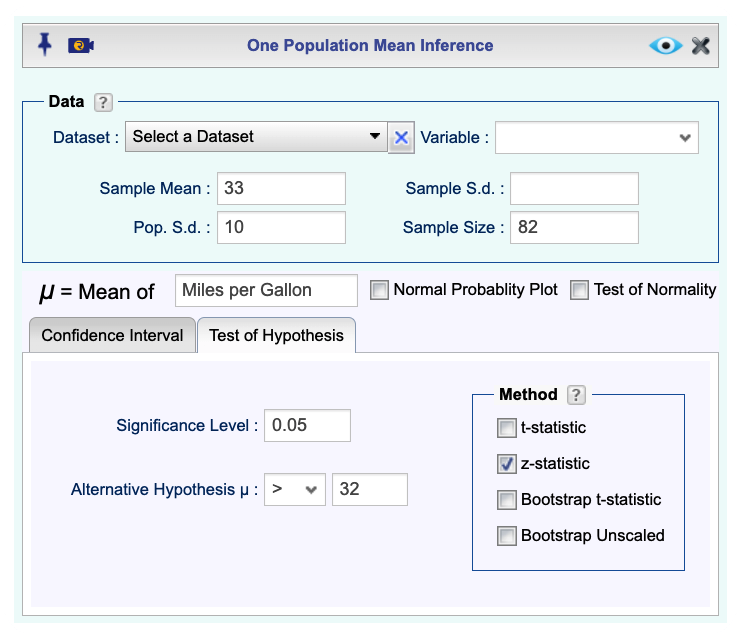
Using summary statistics:
-
Open the Analytics toolbox on the left-hand side of the Rguroo window. Use the Analysis dropdown menu, choose the Mean Inference option, and then select One Population.
-
Fill out the values for Sample Mean, Pop. S.d., and Sample Size.
-
Write a label for the parameter in the text box μ = Mean of.
-
Click the Test of Hypothesis tab and
-
Type in Significance Level.
-
Input the alternative hypothesis by selecting one of <, >, != and entering a value for the Alternative hypothesis.
-
Check the z-statistic checkbox.
-
-
Click the preview icon
to see the result.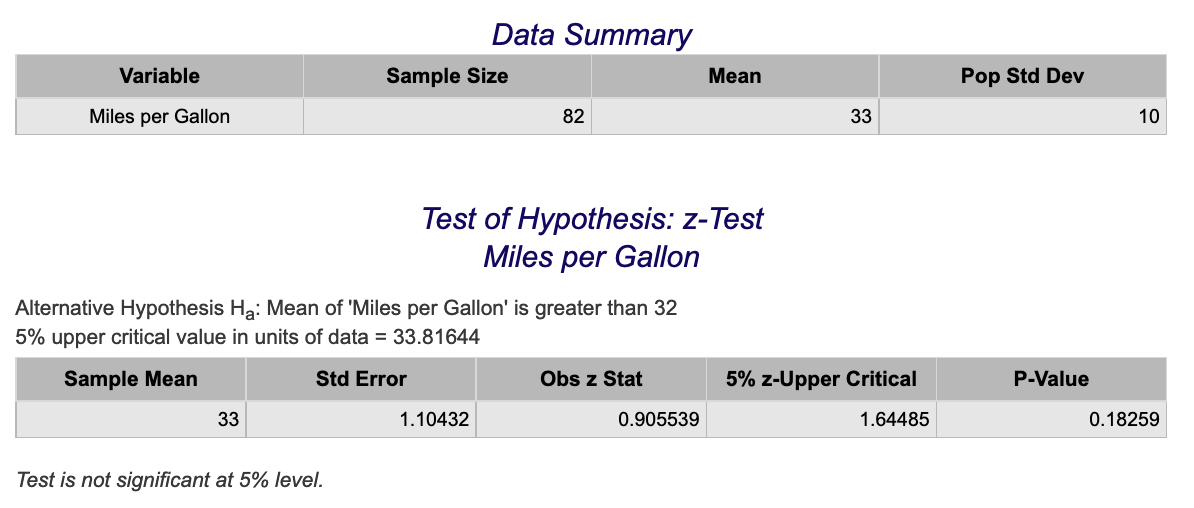
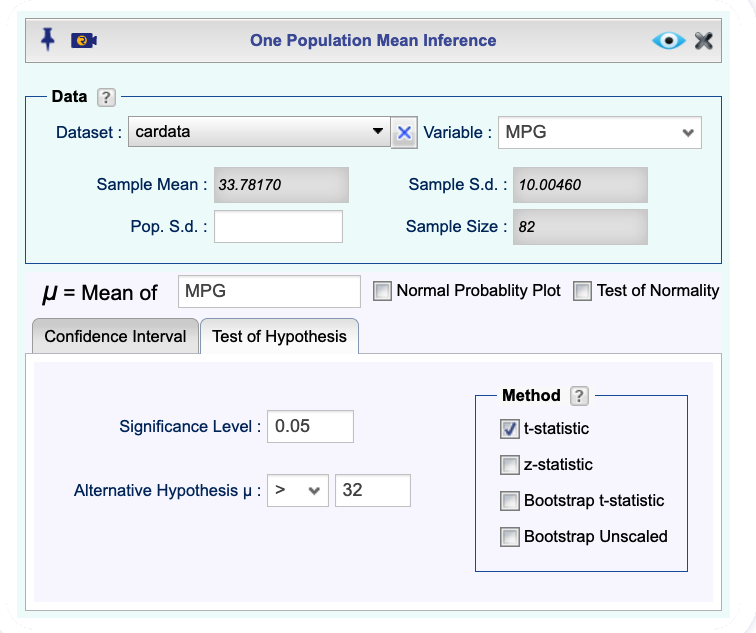
t-Test
Using Raw Data
-
See Creating a Dataset to input your data or recreate the example below by Accessing the Rguroo Data Repository and using the 'cardata' dataset found in the 'Rguroo Users Guide' repository.
-
Open the Analytics toolbox on the left-hand side of the Rguroo window. Use the Analysis dropdown menu, choose the Mean Inference option, and then select One Population.
-
Select a Dataset and a Variable. The sample statistics will automatically populate.
-
Click the Test of Hypothesis tab and
-
Type in Significance Level.
-
Input the alternative hypothesis by selecting one of <, >, != and entering a value for the Alternative hypothesis.
-
Check the t-statistic checkbox.
-
-
Click the preview icon
to see the result.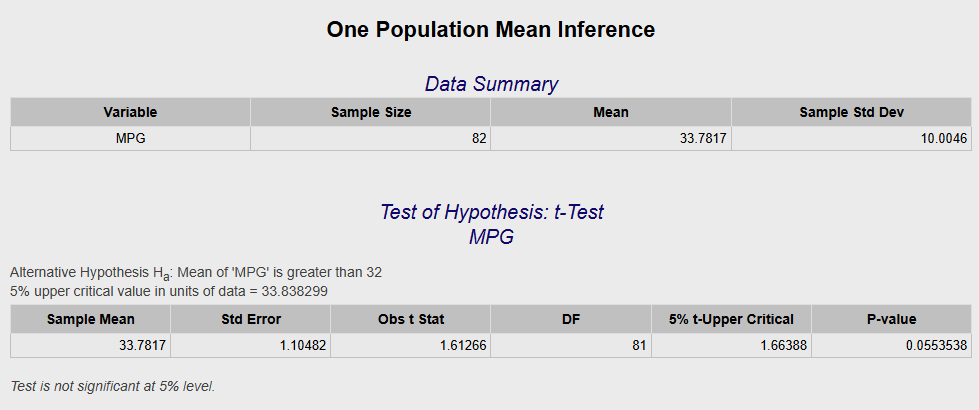
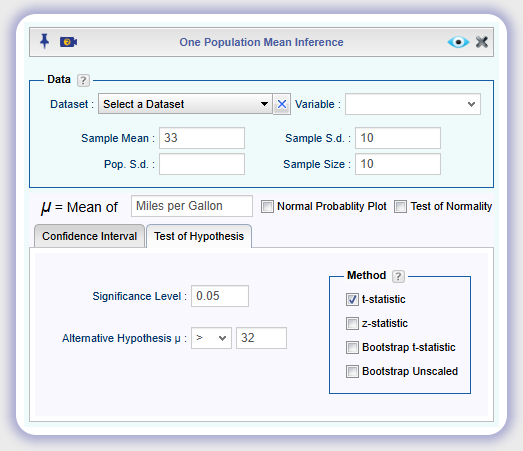
Using summary statistics:
-
Open the Analytics toolbox on the left-hand side of the Rguroo window. Use the Analysis dropdown menu, choose the Mean Inference option, and then select One Population.
-
Fill out the values for Sample Mean, Sample S.d., and Sample Size.
-
Write a label for the parameter in the text box μ = Mean of.
-
Click the Test of Hypothesis tab and
-
Type in Significance Level.
-
Input the alternative hypothesis by selecting one of <, >, != and entering a value for the Alternative hypothesis.
-
Check the t-statistic checkbox.
-
-
Click the preview icon
to see the result.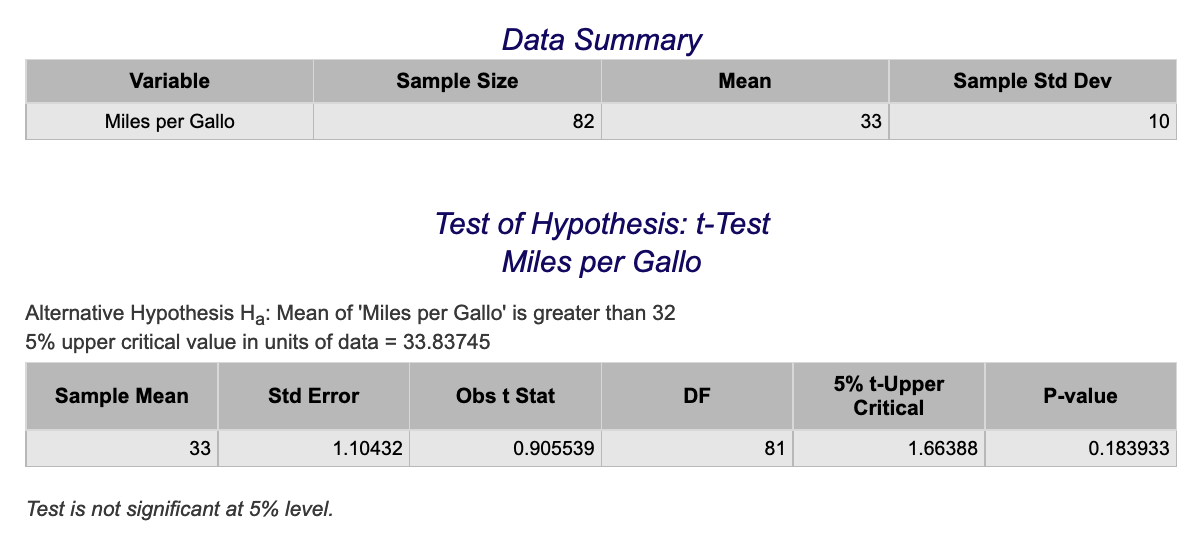
One Proportion z-Test
Using Raw Data
-
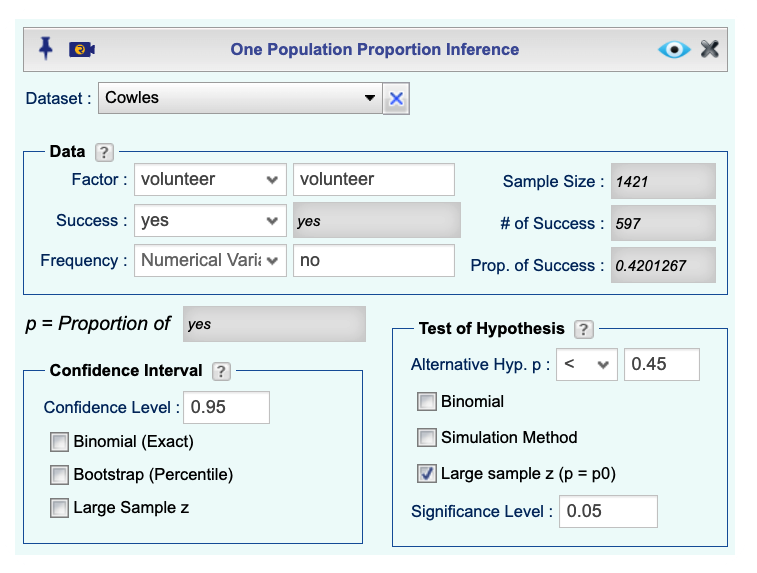
See Creating a Dataset to input your data or recreate the example below by Accessing the Rguroo Data Repository and using the 'Cowles' dataset found in the 'car' repository.
-
Open the Analytics toolbox on the left-hand side of the Rguroo window. Use the Analysis dropdown menu, choose the Proportion Inference option, and then select One Population.
-
Select a Dataset and Factor variable and Success level. The summary statistics will be automatically populated.
-
Under the Test of Hypothesis section:
input the alternative hypothesis by selecting one of <, >, != and entering a value for the Alternative hypothesis,
check the Large Sample z (p=p0) checkbox,
and set the Significance Level.
-
Click the preview icon
to see the result.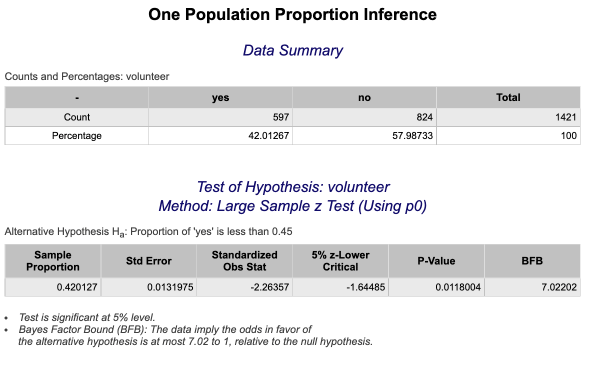
Using Summary Statistics
-
Open the Analytics toolbox on the left-hand side of the Rguroo window. Use the Analysis dropdown menu, choose the Proportion Inference option, and then select One Population.
-
Fill in labels for Factor, Success, and optionally Failure.
-
Input numerical values for Sample Size, and # of Success.
-
Under the Test of Hypothesis section:
input the alternative hypothesis by selecting one of <, >, != and entering a value for the Alternative hypothesis,
check the Large Sample z (p=p0) checkbox,
and set the Significance Level.
-
Click the preview icon
to see the result.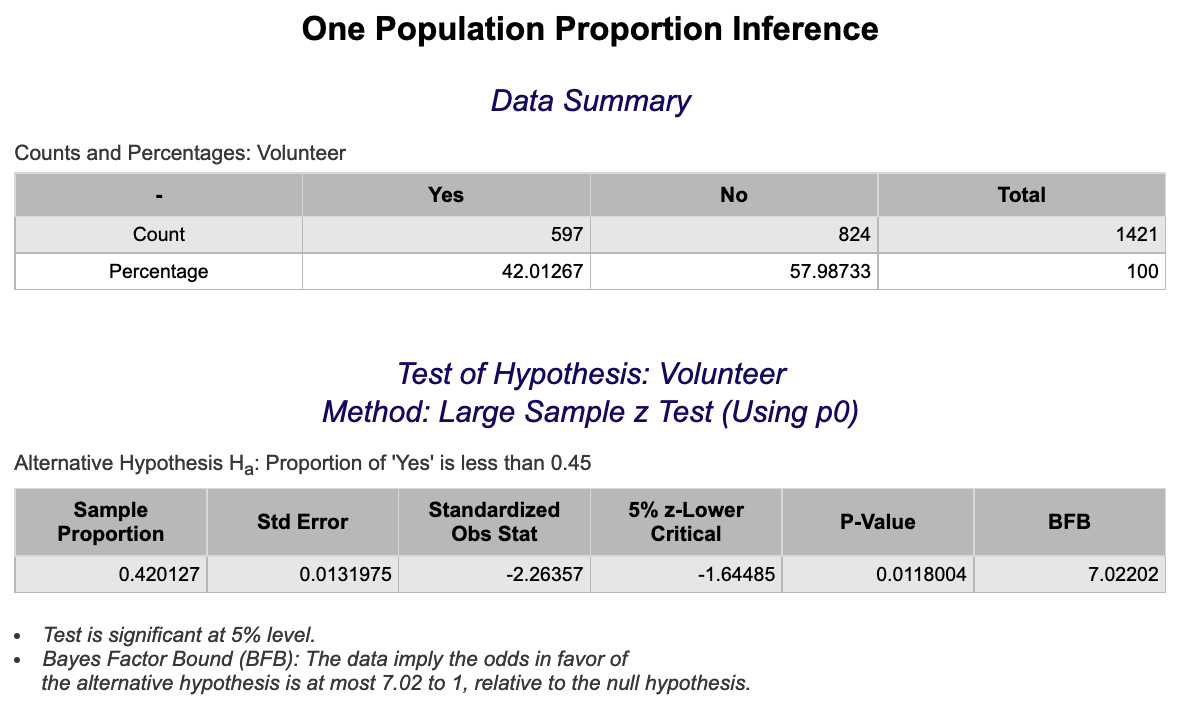
Two Proportion z-Test
Using Raw Data
-
See Creating a Dataset to input your data or recreate the example below by Accessing the Rguroo Data Repository and using the 'cardata' dataset found in the 'Rguroo Users Guide' repository.
-
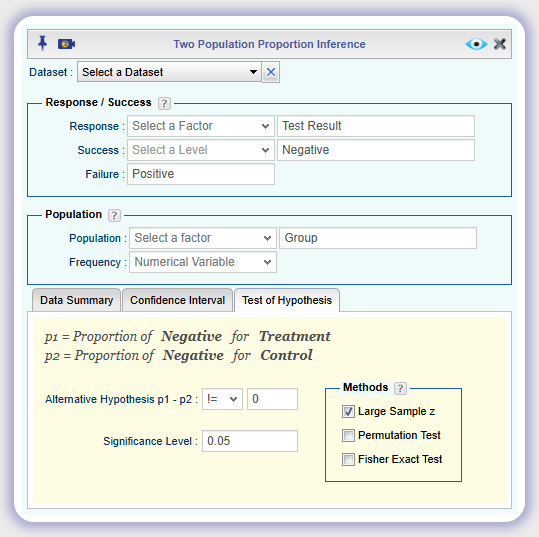
Open the Analytics toolbox on the left-hand side of the Rguroo window. Use the Analysis dropdown menu, choose the Proportion Inference option, and then select Two Populations.
-
Select a Dataset.
-
In the Response/Success section, select a Response variable and the level indicating Success. Optionally, you can type in a label for Failure.
-
In the Population section, select a variable for Population that indicates the population (explanatory variable). If your data is in tabular form, you can select the numerical variable that includes the Frequency for each level.
-
In the Data Summary tab, for each of Population 1 and Population 2 choose the corresponding Level. Clicking on the refresh button will load the Sample Size, # of Successes, and Proportion of Success for each population.
-
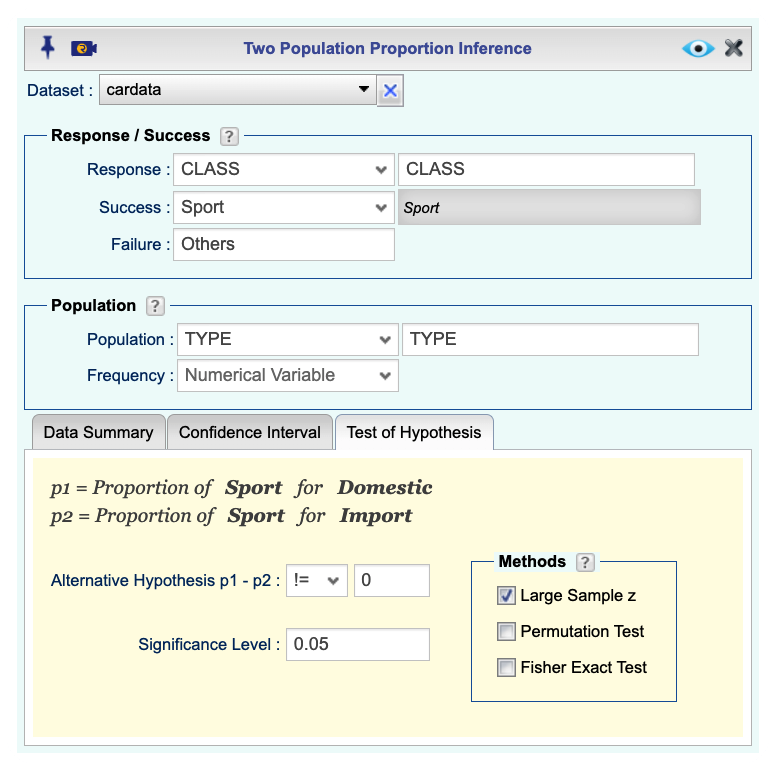
Select the Test of Hypothesis tab. Then:
input the alternative hypothesis by selecting one of <, >, != and entering a value for the Alternative hypothesis,
check the Large Sample z checkbox,
and set the Significance Level.
-
Click the preview icon
to see the result.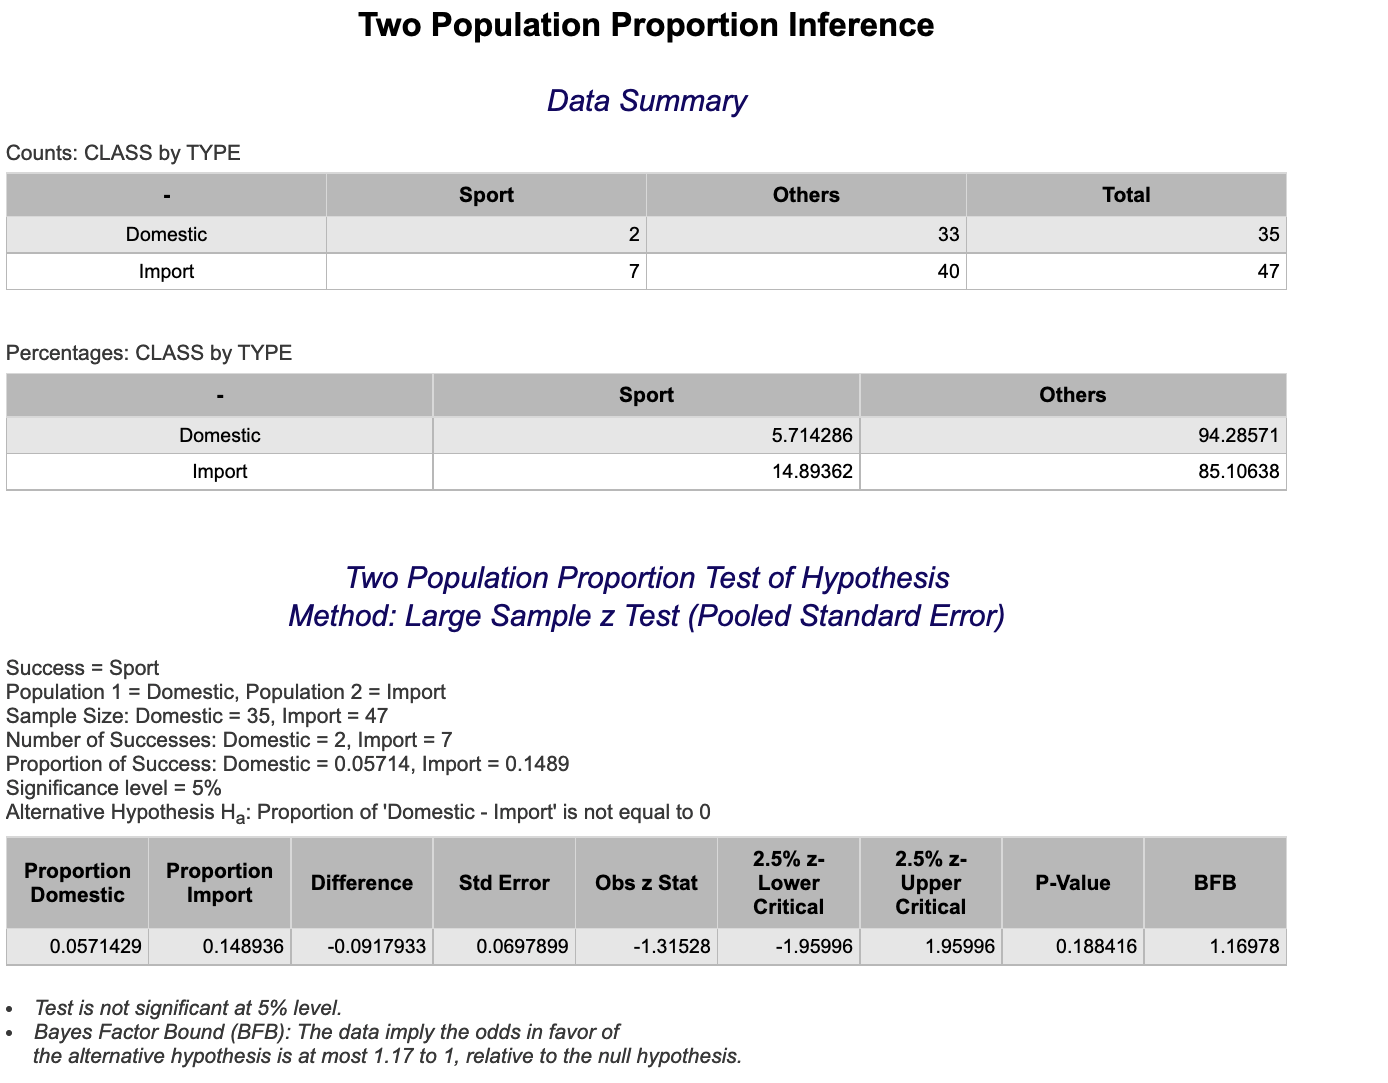
Using Summary Statistics
-
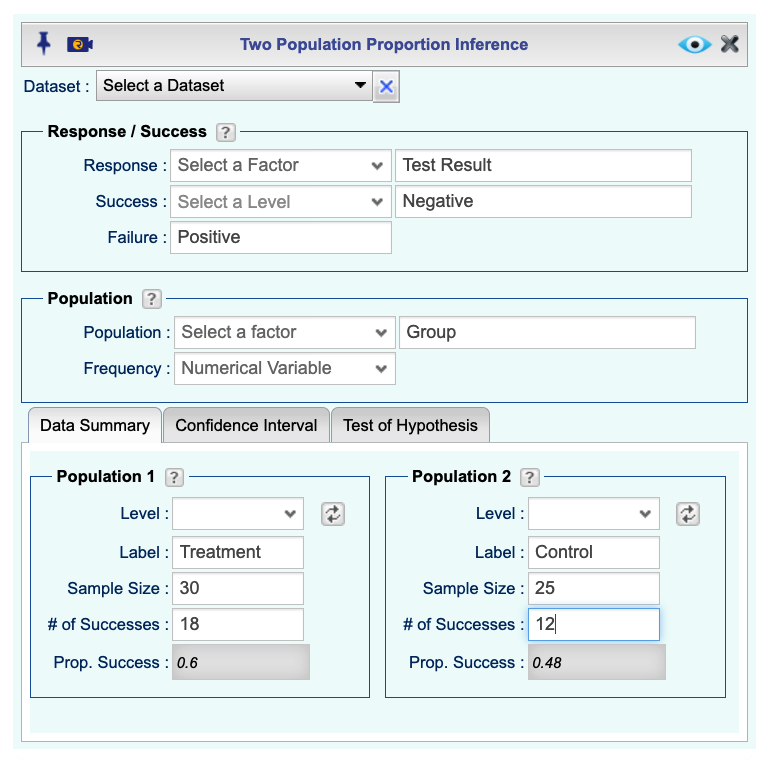
Open the Analytics toolbox on the left-hand side of the Rguroo window. Use the Analysis dropdown menu, choose the Proportion Inference option, and then select Two Populations.
-
In the Response/Success section, type in a label for the Response variable and a label for Success. Optionally, you can type in a label for Failure.
-
In the Population section, type in a label for the population variable.
-
In the Data Summary tab, for each of Population 1 and Population 2 type in the following: Label, Sample size, and # of Successes.
-
Select the Test of Hypothesis tab. Then:
input the alternative hypothesis by selecting one of <, >, != and entering a value for the Alternative hypothesis,
check the Large Sample z checkbox,
and set the Significance Level.
-
Click the preview icon
to see the result.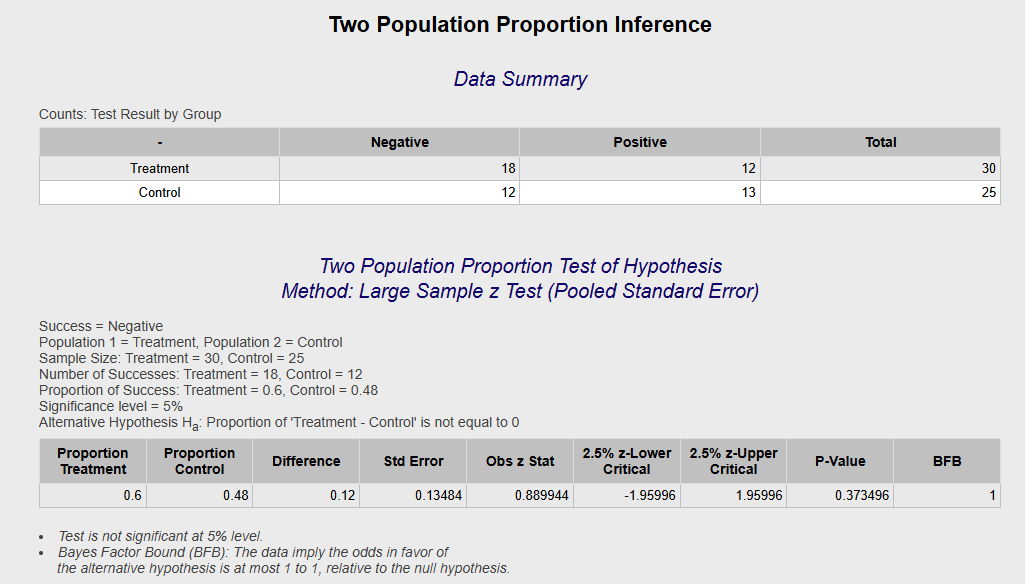
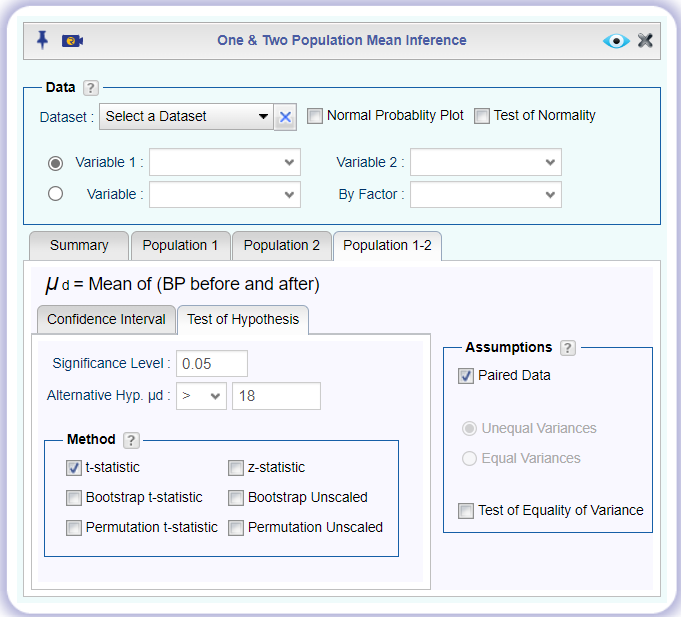
Two Sample t-Test (Dependent Samples, Paired Difference)
Using Raw Data
-
See Creating a Dataset to input your data or recreate the example below by Accessing the Rguroo Data Repository and using the 'LA CountyOzoneRandom' dataset found in the 'Rguroo Users Guide' repository.
-
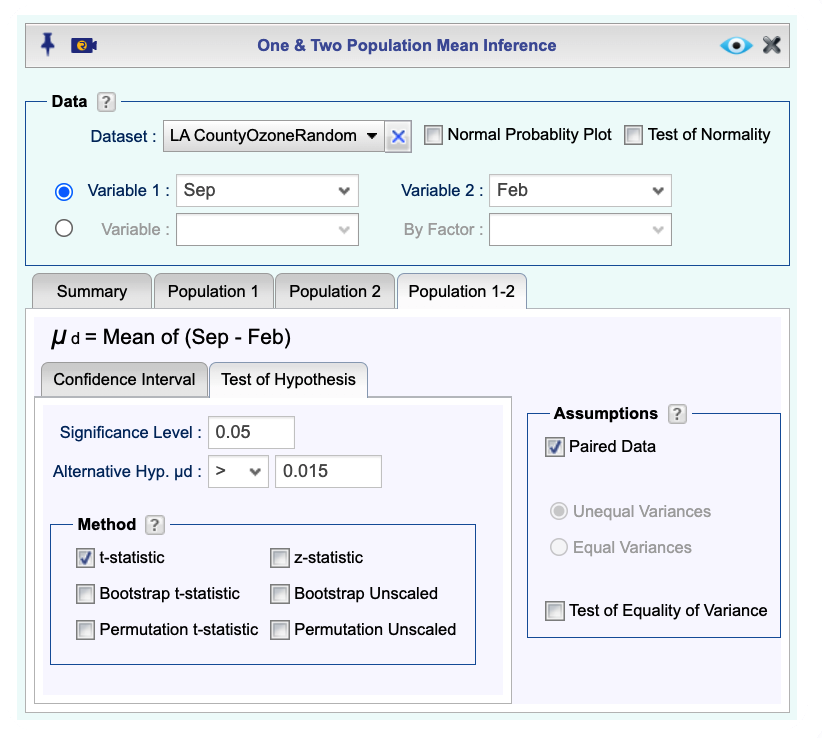
Open the Analytics toolbox on the left-hand side of the Rguroo window. Use the Analysis dropdown menu, choose the Mean Inference option, and then select One & Two Population.
-
Select a Dataset, Variable 1, and Variable 2. The summary statistics in the Summary tab will be automatically populated.
Note, if the populations are identified by a categorical variable, use the option of Variable and By Factor. Also, the number of cases for both populations must be the same for paired data.
-
Check the Paired Data checkbox. The summary data for paired differences will show in the Summary tab.
-
Select the Population 1-2 tab, select the Test of Hypothesis tab, and
-
type in the Significance Level;
-
input the alternative hypothesis by selecting one of <, >, != and entering a value for the Alternative hypothesis;
-
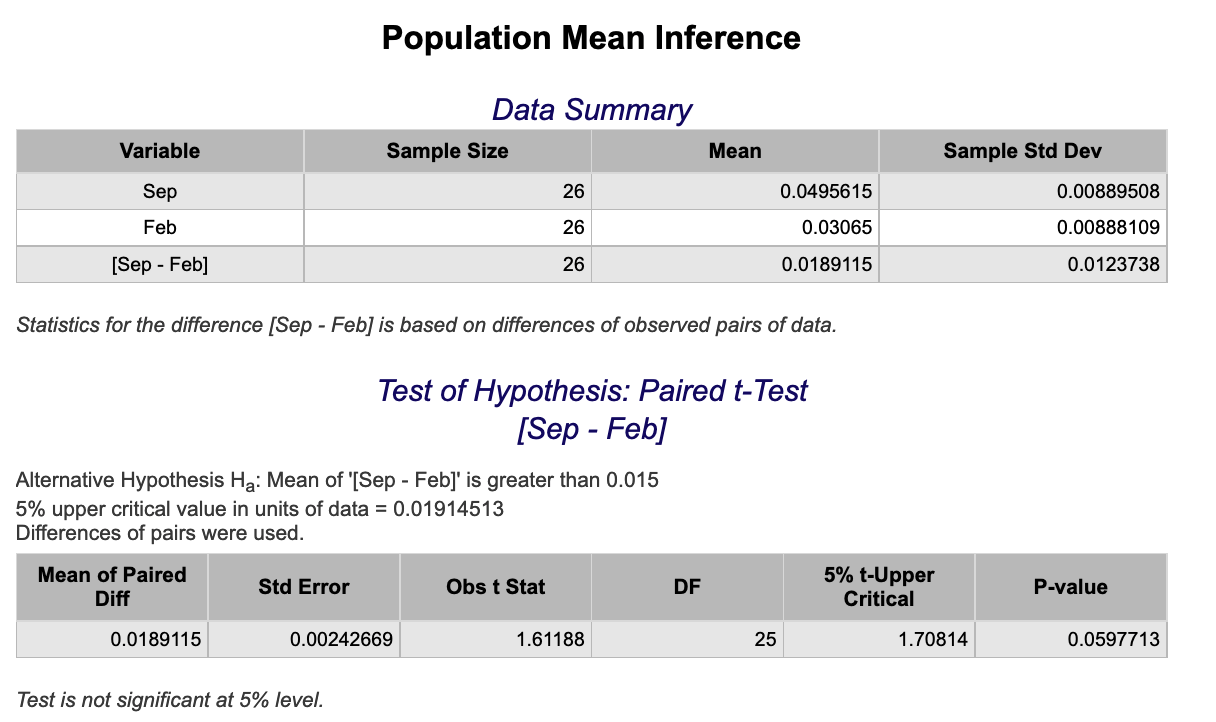
and under the Method section, check the t-statistic checkbox.
-
Click the preview icon ![]() .
.
Using Summary Statistics
-
Open the Analytics toolbox on the left-hand side of the Rguroo window. Use the Analysis dropdown menu, choose the Mean Inference option, and then select One & Two Population.
-
Under the Summary tab check the Paired Data checkbox.
-
In the Paired Difference section of the Summary tab enter your data:
-
Type in a Label.
-
In the Sample Mean textbox, type the mean of the paired differences.
-
In the Sample S.d. textbox, type the sample standard deviation of the paired differences.
-
In the Sample Size textbox, type the sample size.
-
-
Select the Population 1-2 tab, select the Test of Hypothesis tab, and
-
type in the Significance Level;
-
input the alternative hypothesis by selecting one of <, >, != and entering a value for the Alternative hypothesis;
-
and under the Method section, check the t-statistic checkbox.
-
-
Click the preview icon
to see the result.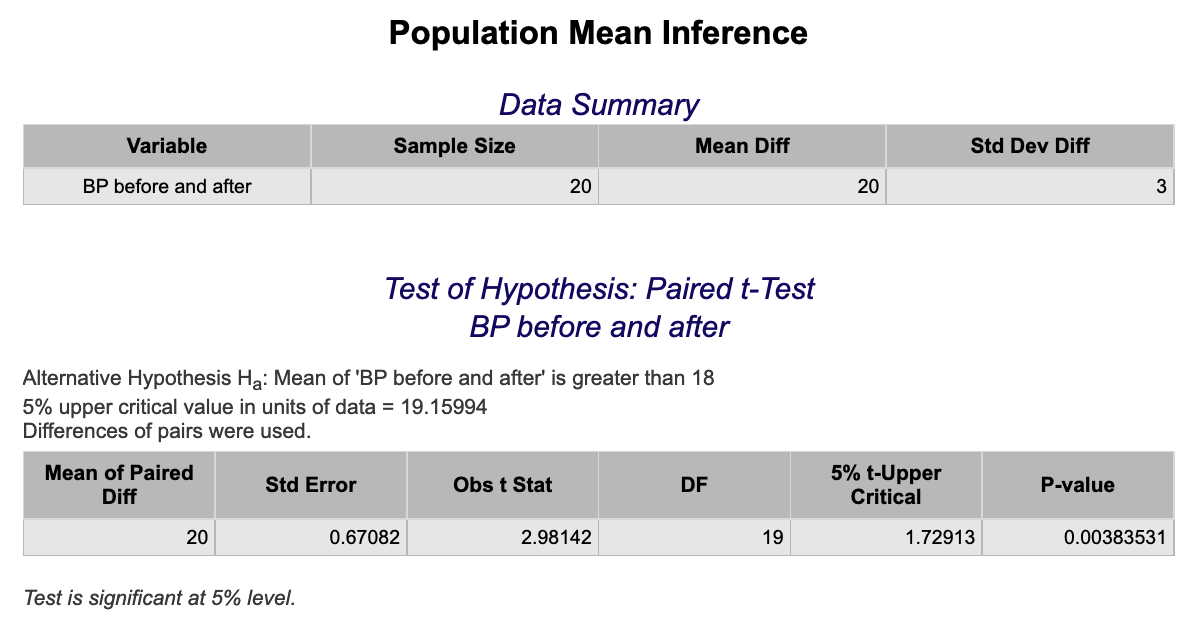
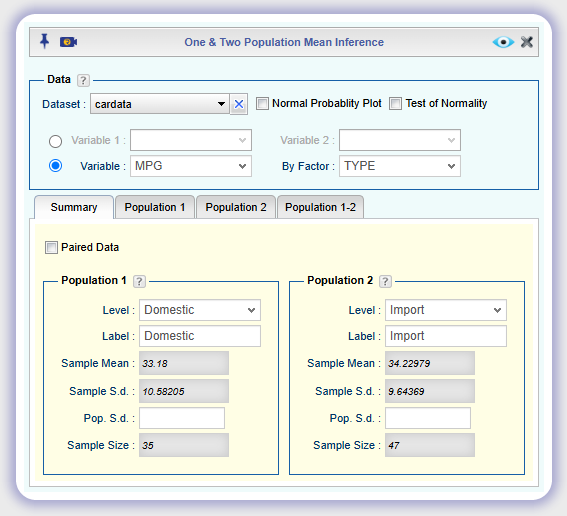
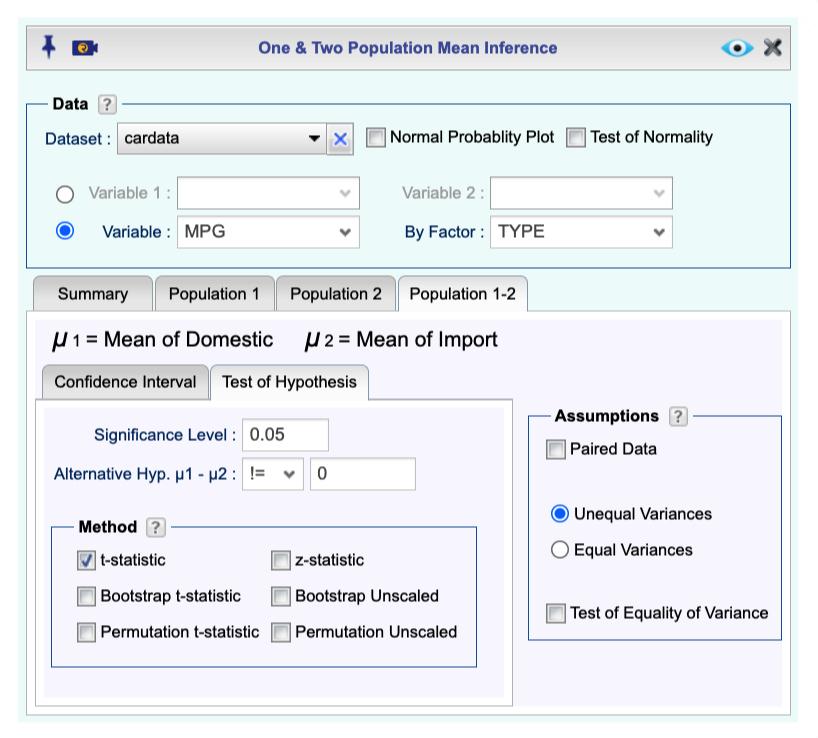
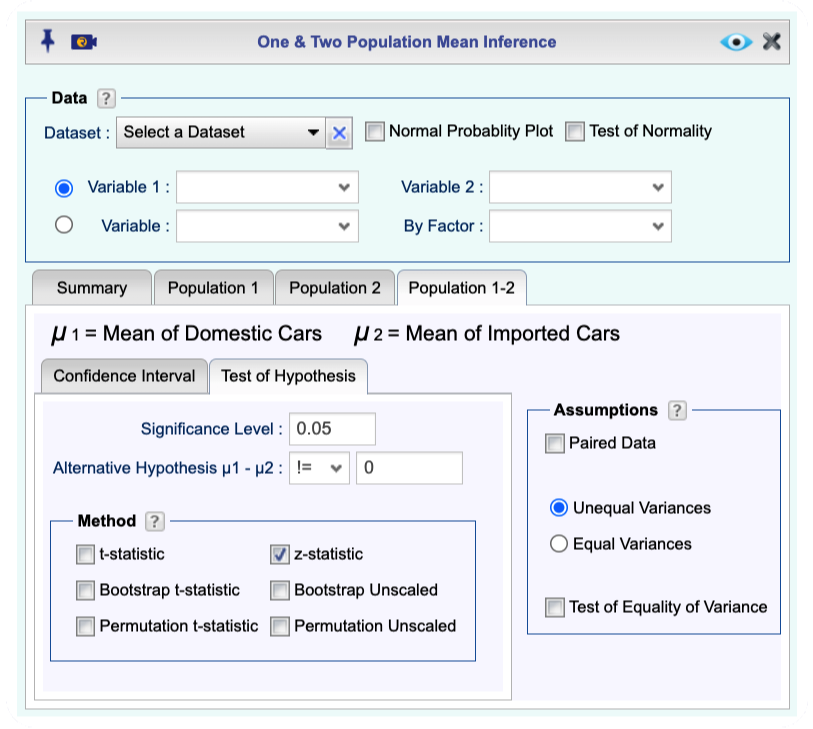
Two Sample t-Test (Independent Samples)
Using Raw Data
-
See Creating a Dataset to input your data or recreate the example below by Accessing the Rguroo Data Repository and using the 'cardata' dataset found in the 'Rguroo Users Guide' repository.
-
Open the Analytics toolbox on the left-hand side of the Rguroo window. Use the Analysis dropdown menu, choose the Mean Inference option, and then select One & Two Population.
-
Select a Dataset, Variable 1, and Variable 2. The summary statistics in the Summary tab will be automatically populated.
Note, if the populations are identified by a categorical variable, use the option of Variable and By Factor. Then, in the Summary tab, choose a Level for the Factor.
-
Open the Population 1-2 tab, then under the Test of Hypothesis tab
-
Type in the Significance Level.
-
Input the alternative hypothesis by selecting one of <, >, != and entering a value for the Alternative hypothesis.
-
Check the t-statistic checkbox.
-
Select one of Unequal Variance or Equal Variance.
-
-
Click the preview icon
to see the result.
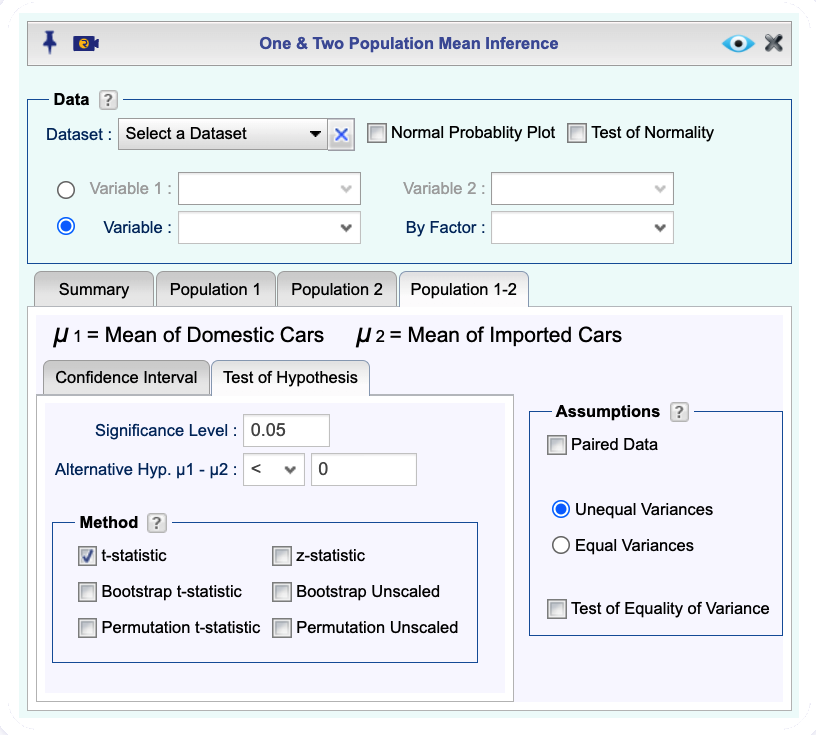
Using Summary Statistics
-
Open the Analytics toolbox on the left-hand side of the Rguroo window. Use the Analysis dropdown menu, choose the Mean Inference option, and then select One & Two Population.
-
In the Summary tab
-
Under the Population 1 Section, type Label, Sample Mean, Sample S.d. (or Population S.d.), and Sample Size for population 1.
-
Under the Population 2 Section, type Label, Sample Mean, Sample S.d. (or Population S.d.), and Sample Size for population 2.
-
-
Open the Population 1-2 tab, then under the Test of Hypothesis tab
-
Type in the Significance Level.
-
Input the alternative hypothesis by selecting one of <, >, != and entering a value for the Alternative hypothesis.
-
Check the t-statistic checkbox.
-
Select one of Unequal Variance or Equal Variance.
-
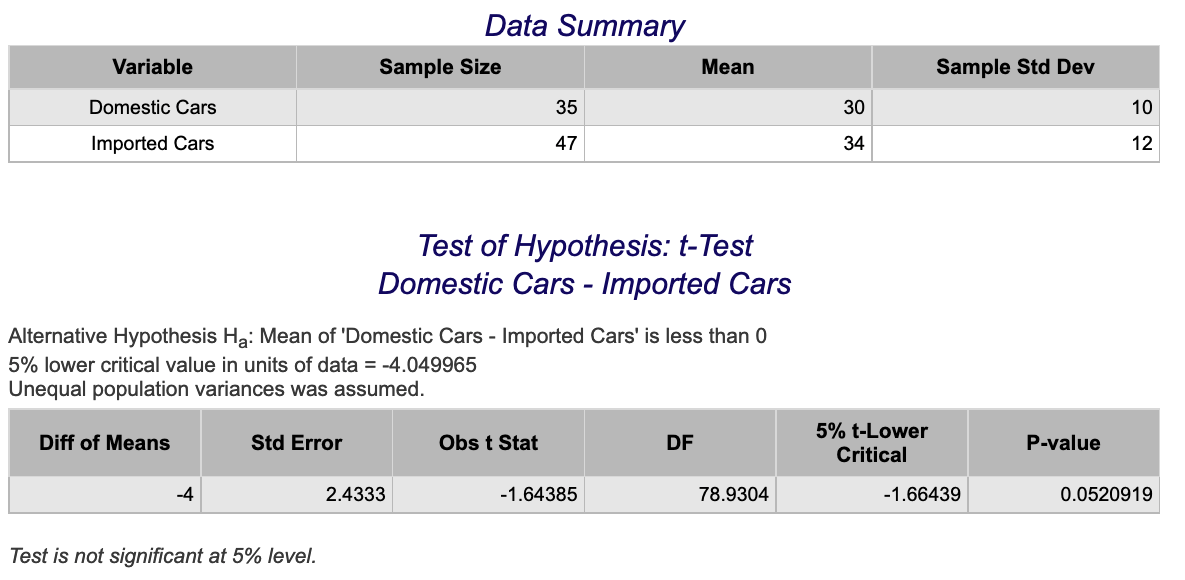
Click the preview icon ![]() to see the result.
to see the result.
Two Sample z-Test
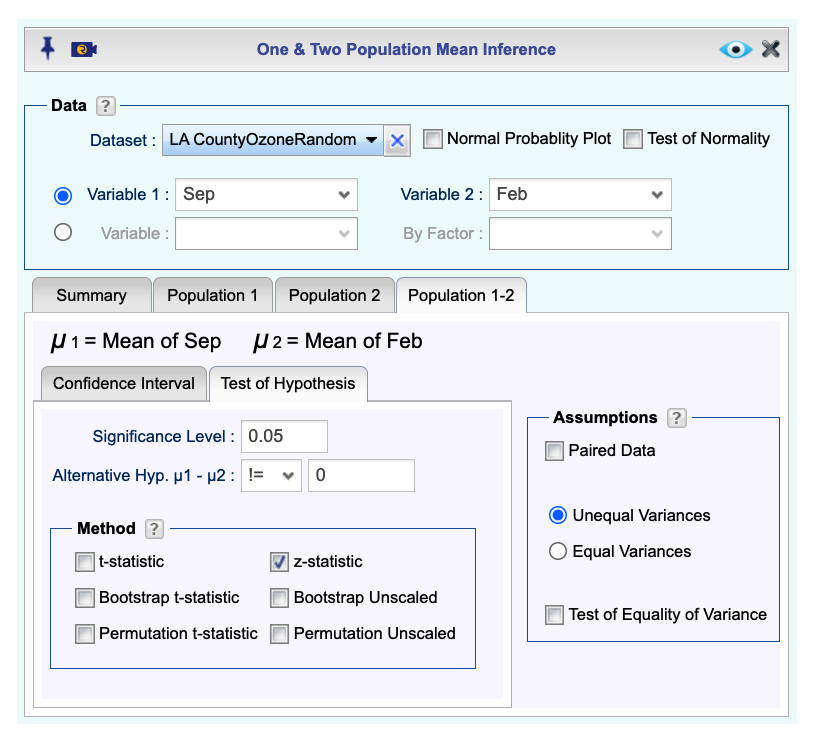
Using Raw Data
-
See Creating a Dataset to input your data or recreate the example below by Accessing the Rguroo Data Repository and using the 'LA CountyOzoneRandom' dataset found in the 'Rguroo Users Guide' repository.
-
Open the Analytics toolbox on the left-hand side of the Rguroo window. Use the Analysis dropdown menu, choose the Mean Inference option, and then select One & Two Population.
-
Select a Dataset, Variable 1, and Variable 2. The summary statistics in the Summary tab will be automatically populated.
Note, if the populations are identified by a categorical variable, use the option of Variable and By Factor.
-
Open the Population 1-2 tab, then under the Test of Hypothesis tab
-
Type in the Significance Level.
-
Input the alternative hypothesis by selecting one of <, >, != and entering a value for the Alternative hypothesis.
-
Check the z-statistic checkbox.
-
-
Click the preview icon
to see the result.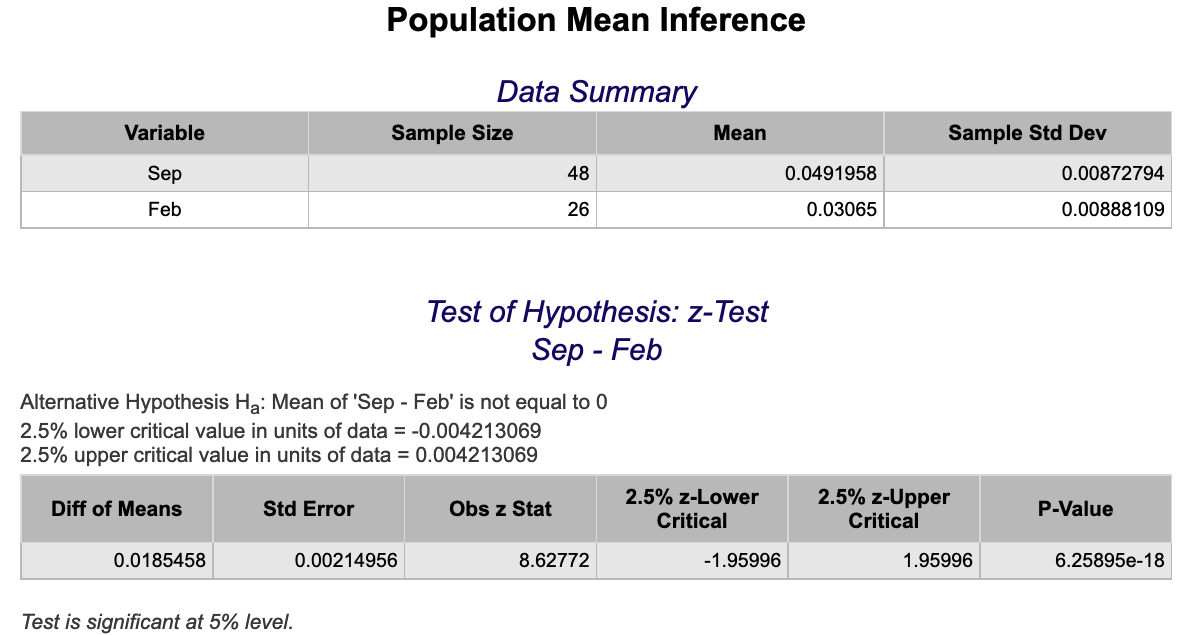
Using Summary Statistics
-
Open the Analytics toolbox on the left-hand side of the Rguroo window. Use the Analysis dropdown menu, choose the Mean Inference option, and then select One & Two Population.
-
In the Summary tab
-
Under the Population 1 Section, type Label, Sample Mean, Sample S.d. (or Population S.d.), and Sample Size for population 1.
-
Under the Population 2 Section, type Label, Sample Mean, Sample S.d. (or Population S.d.), and Sample Size for population 2.
-
-
Open the Population 1-2 tab, then under the Test of Hypothesis tab
-
Type in the Significance Level.
-
Input the alternative hypothesis by selecting one of <, >, != and entering a value for the Alternative hypothesis.
-
Check the z-statistic checkbox.
-
-
Click the preview icon
to see the result.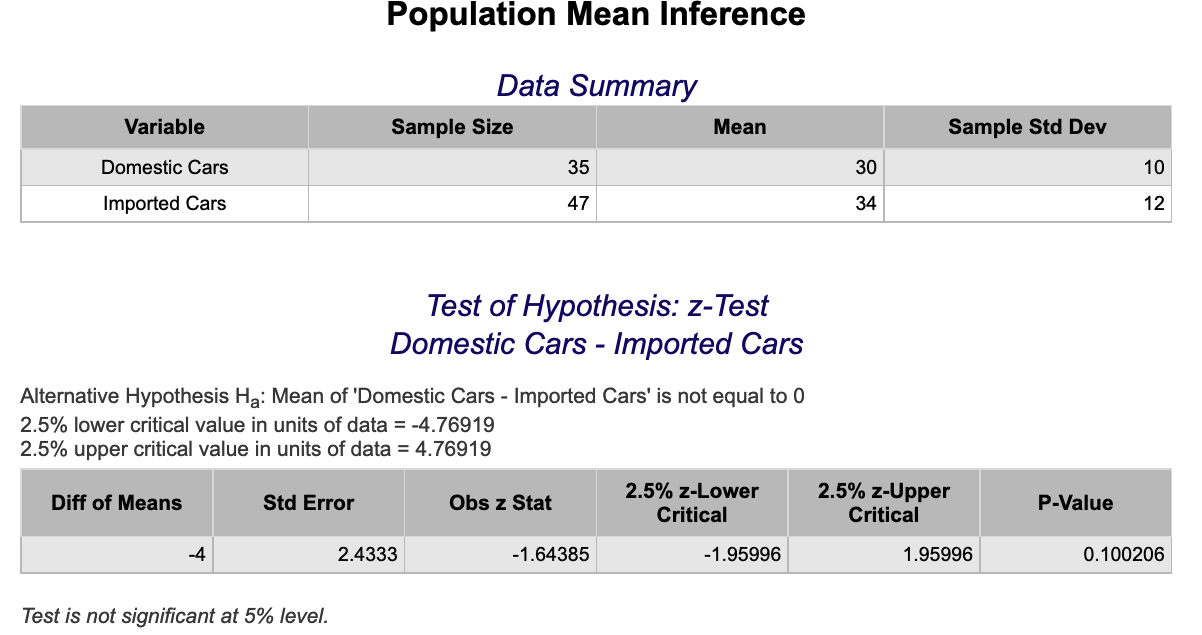
Two Sample F-Test
See ANOVA, One-Way.
Nonparametrics
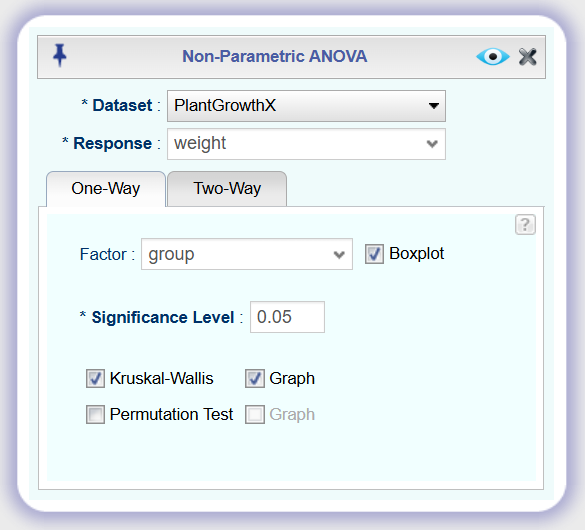
Kruskal-Wallis Test
-
See Creating a Dataset to input your data or recreate the example below by Accessing the Rguroo Data Repository and using the 'PlantGrowthX' dataset found in the 'Rguroo Users Guide' repository.
-
Open the Analytics toolbox on the left-hand side of the Rguroo window. Use the Analysis dropdown menu and choose the Non-Parametric ANOVA option.
-
Select a Dataset and Response variable.
-
Under the one-way tab select a Factor variable (with Boxplot, if desired) and set a Significance Level.
Check the Kruskal-Wallis checkbox (with Graph, if desired).
-
Click the preview icon
to see the result.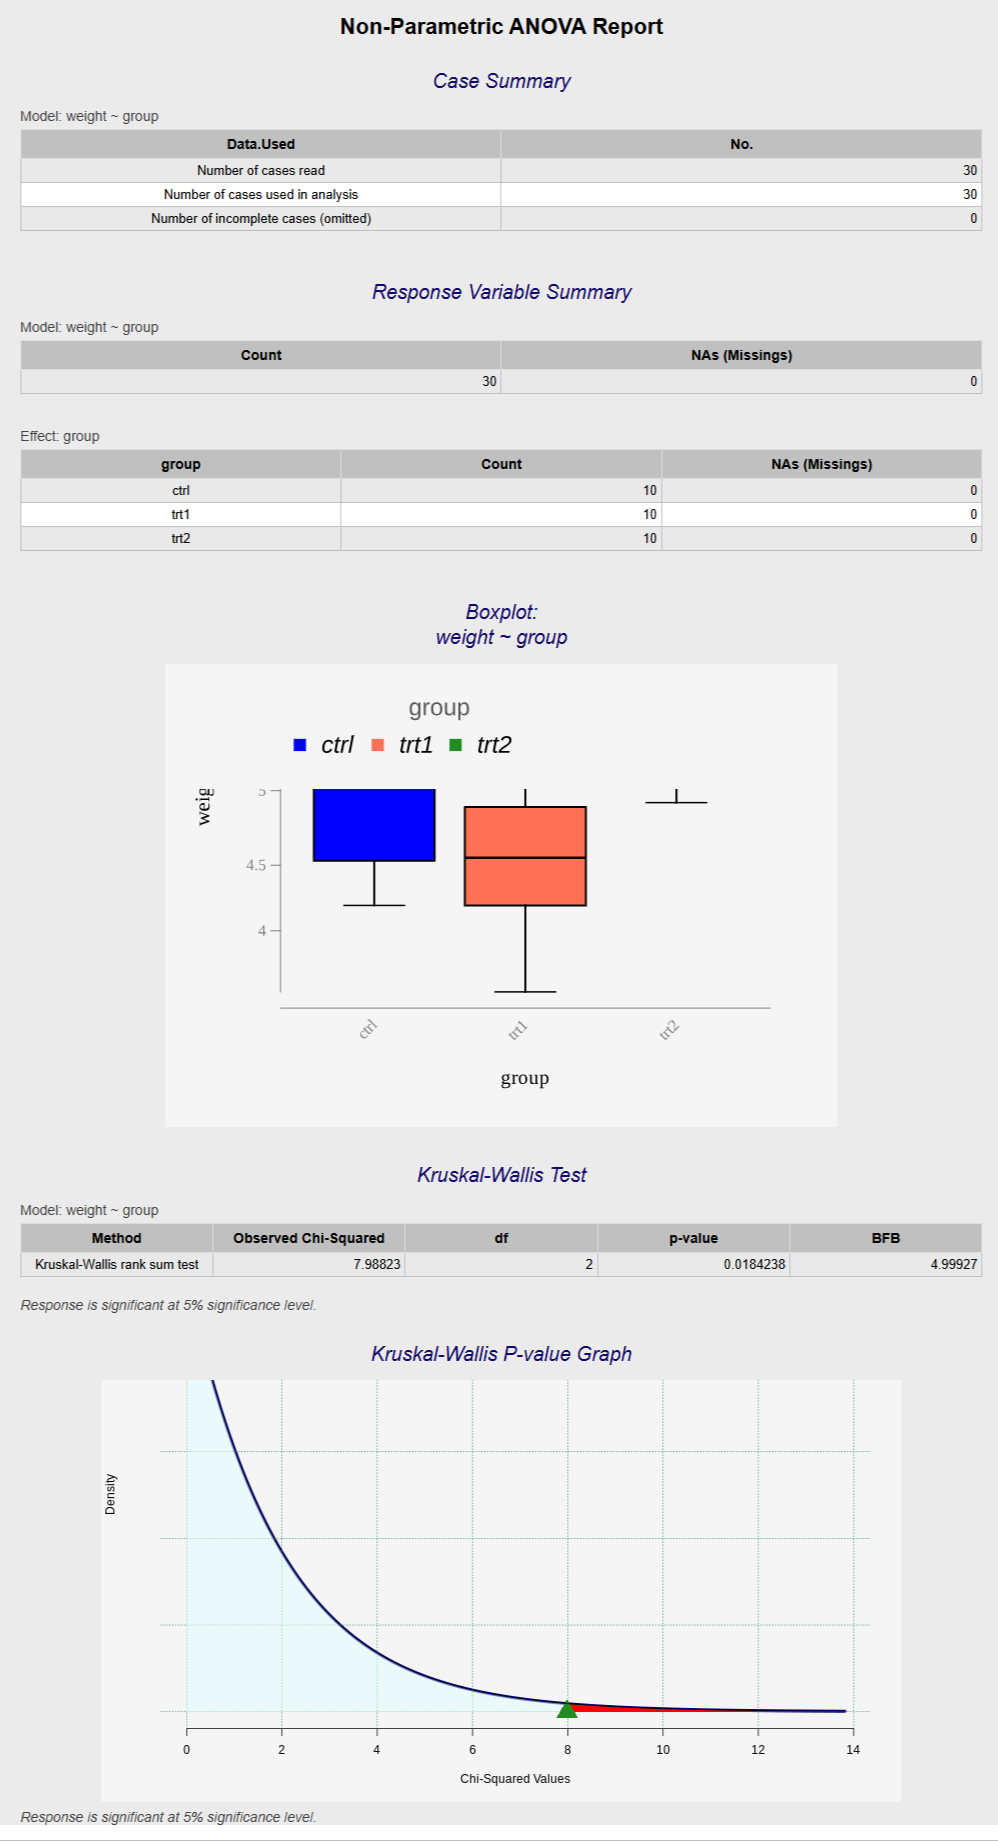
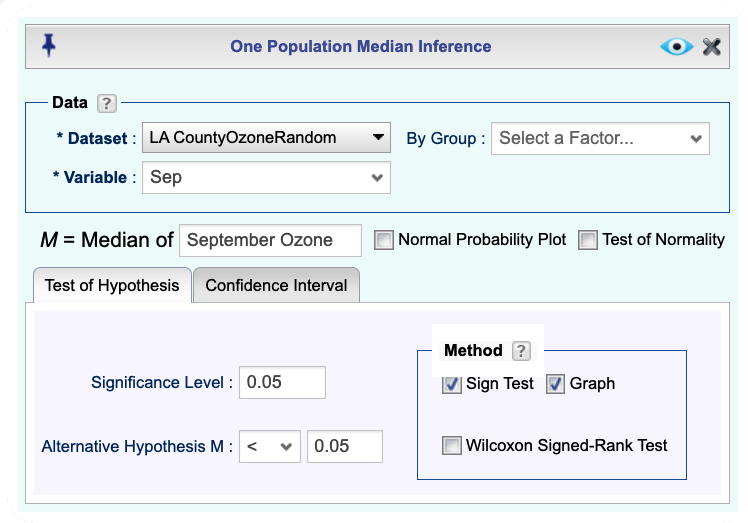
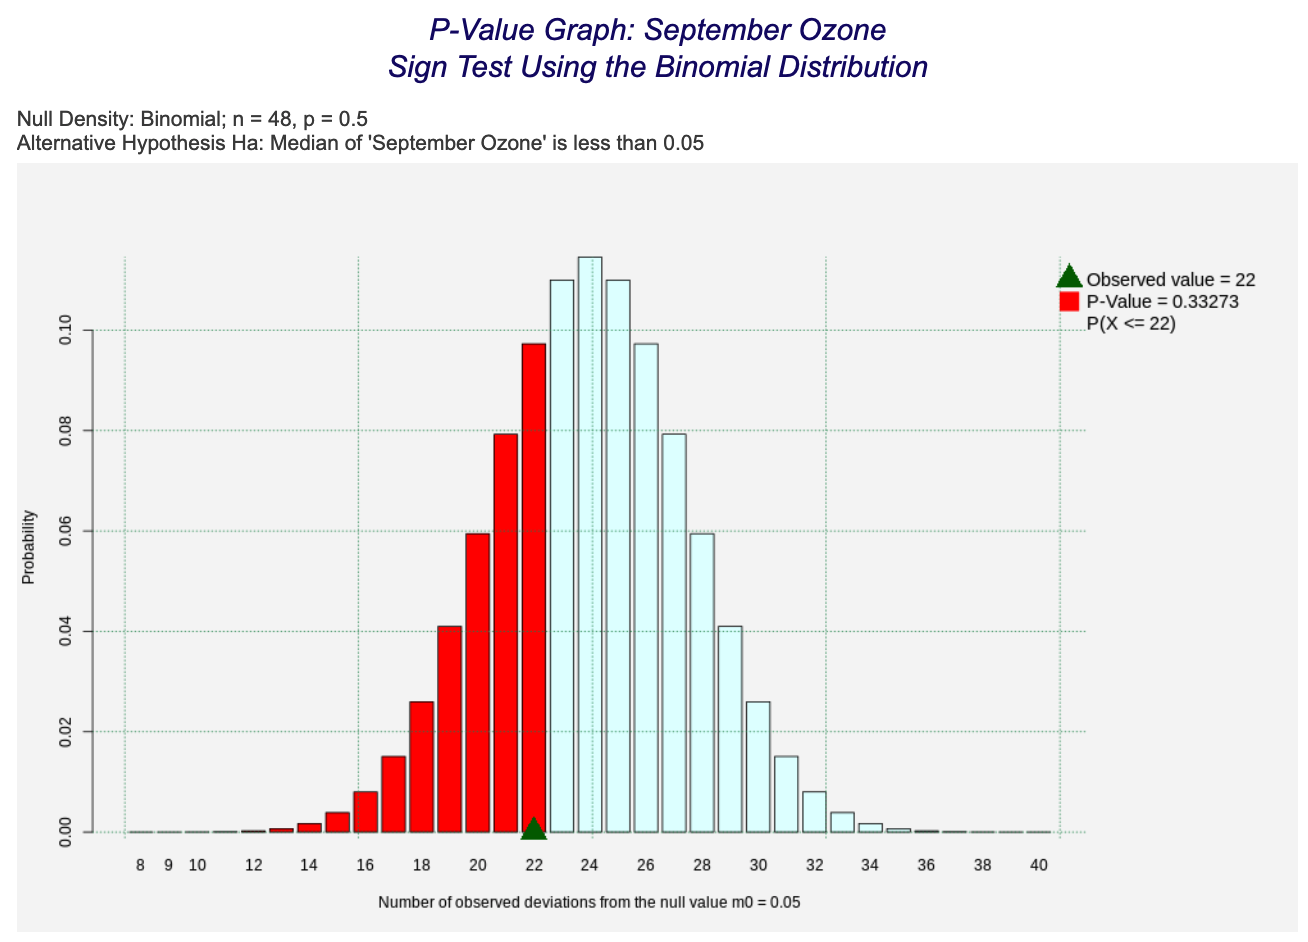
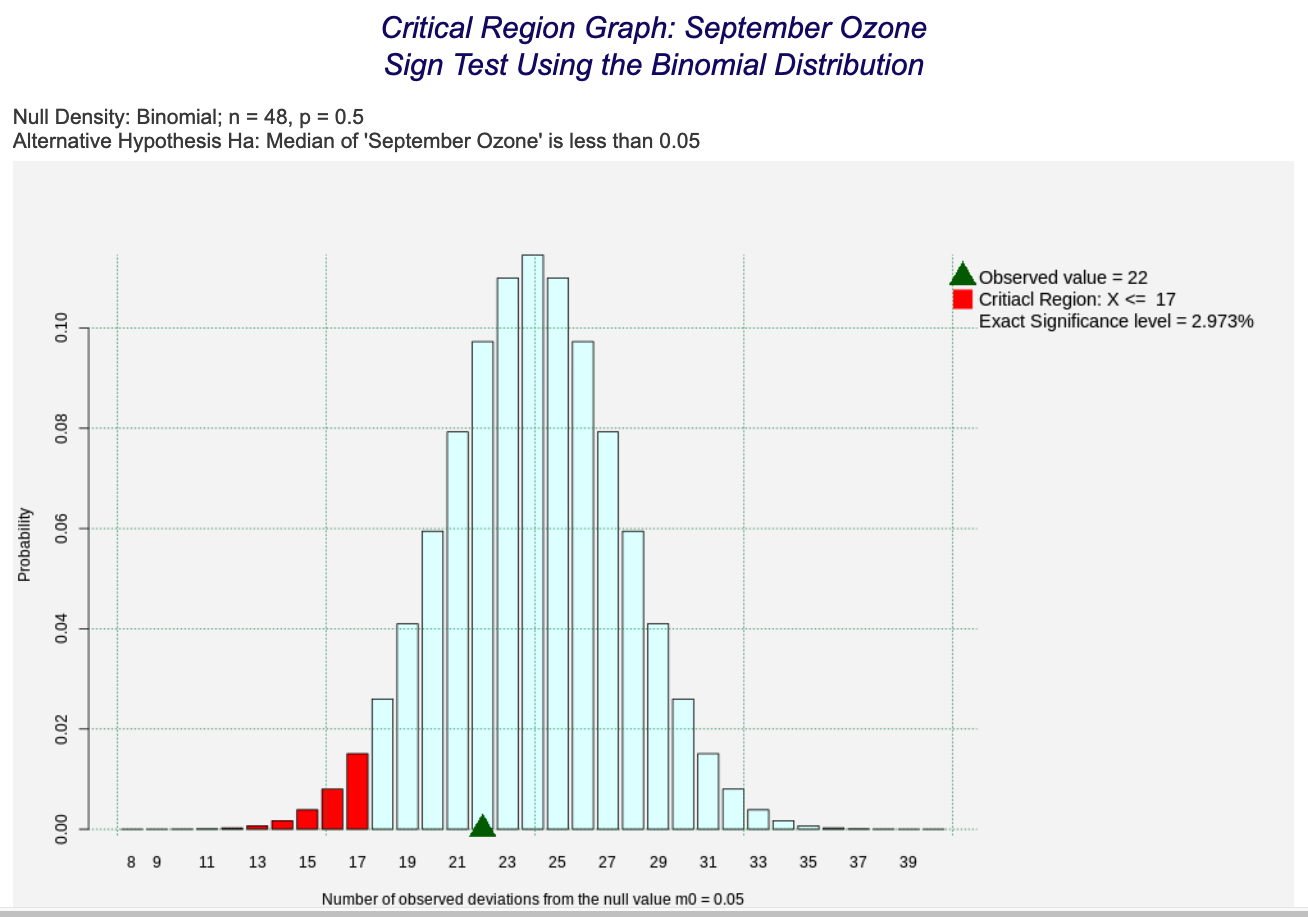
Sign Test
Testing the Population Median
-
See Creating a Dataset to input your data or recreate the example below by Accessing the Rguroo Data Repository and using the 'LA CountyOzoneRandom' dataset found in the 'Rguroo Users Guide' repository.
-
Open the Analytics toolbox on the left-hand side of the Rguroo window. Use the Analysis dropdown menu, choose the Median Inference option, and then select One Population.
-
Select a Dataset and a Variable. Type in a label for the parameter in the textbox "M = Median of."
-
In the Test of Hypothesis tab
-
Type in Significance Level.
-
Input the alternative hypothesis by selecting one of <, >, != and entering a value for the Alternative hypothesis.
-
Check the Sign Test checkbox. Optionally, check the Graph checkbox for a graph output.
-
-
Click the preview icon
to see the result.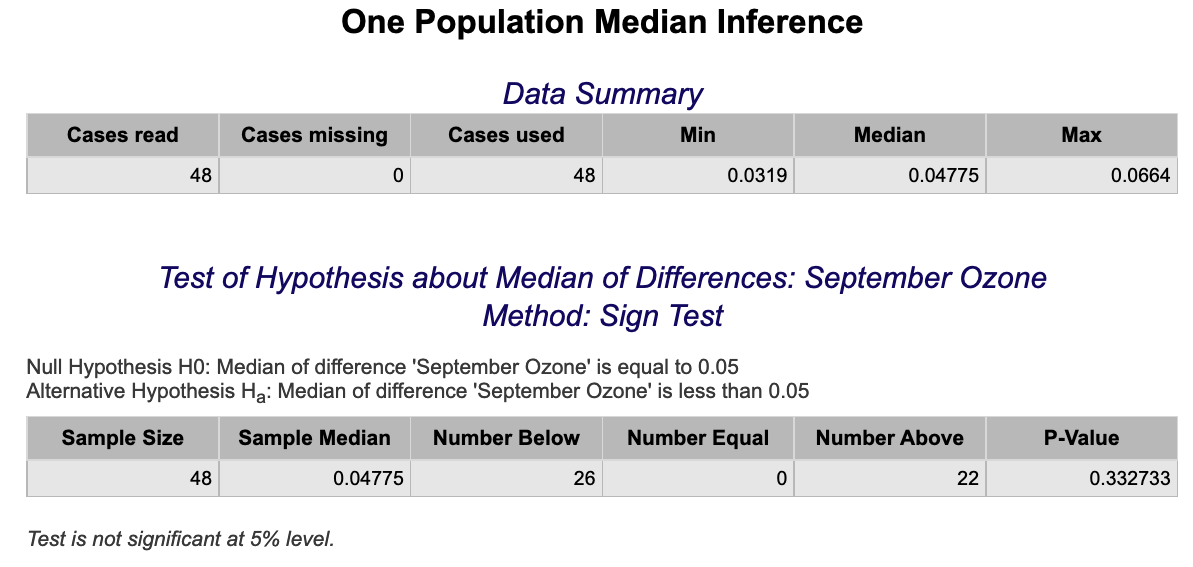
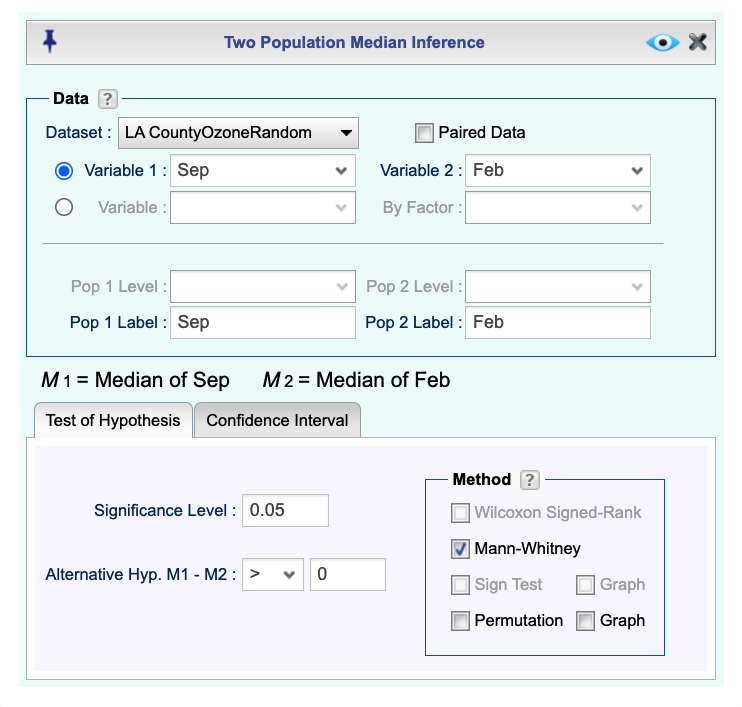
Wilcoxon Rank Sum
Difference of Medians – Independent Samples
-
See Creating a Dataset to input your data or recreate the example below by Accessing the Rguroo Data Repository and using the 'LA CountyOzoneRandom' dataset found in the 'Rguroo Users Guide' repository.
-
Open the Analytics toolbox on the left-hand side of the Rguroo window. Use the Analysis dropdown menu, choose the Median Inference option, and then select Two Population.
-
Select a Dataset. If your data are in two separate columns, select Variable 1 and Variable 2.
Note, if the population is determined by a factor variable in your dataset, select Variable and By Factor and select Pop 1 Level and Pop 2 Level.
-
In the Test of Hypothesis tab
-
Type in Significance Level.
-
Input the alternative hypothesis by selecting one of <, >, != and entering a value for the Alternative hypothesis.
-
-
In the Method section, check the Mann-Whitney checkbox.
Note, that the Mann-Whitney method is the same as the Wilcoxon Rank Sum.
Also note, various options for the Mann-Whitney test are available in the Details dropdown on the top menu bar.

-
Click the preview icon
to see the result.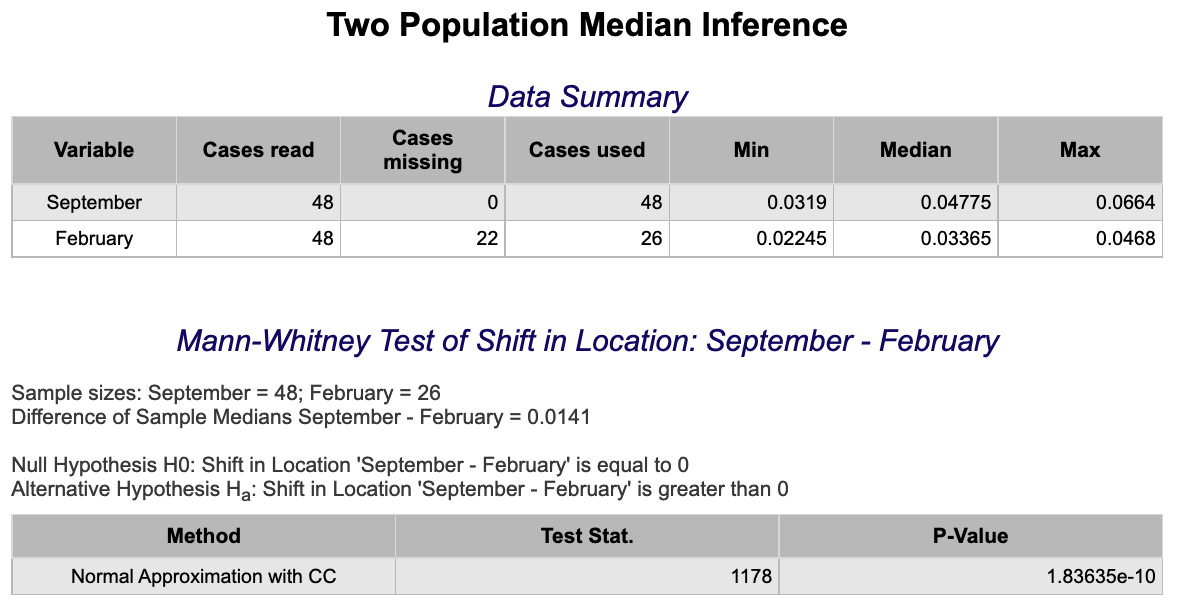
Wilcoxon Signed-Rank or Sign Test
Paired Data
-
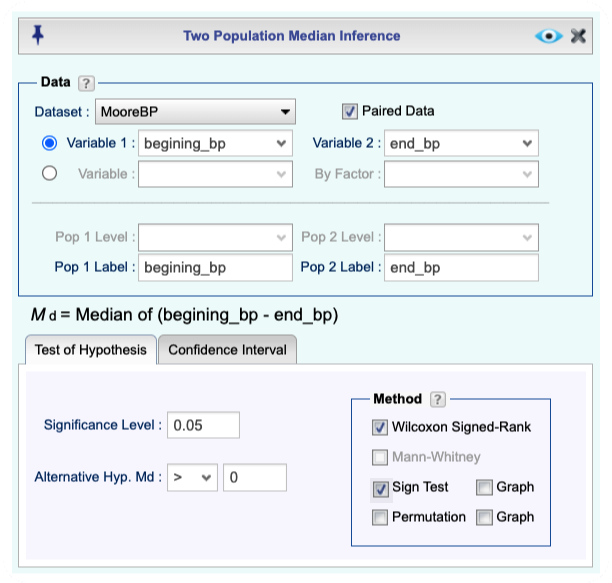
See Creating a Dataset to input your data or recreate the example below by Accessing the Rguroo Data Repository and using the 'MooreBP' dataset found in the 'Rguroo Users Guide' repository.
-
Open the Analytics toolbox on the left-hand side of the Rguroo window. Use the Analysis dropdown menu, choose the Median Inference option, and then select Two Population.
-
Select a Dataset.
-
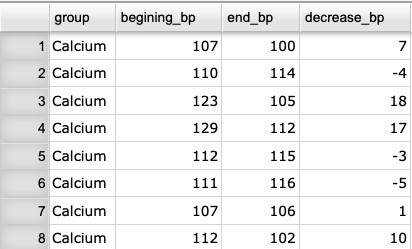
If your data are in two separate columns, select Variable 1 and Variable 2.
-
If the population is determined by a factor variable in your dataset, Select Variable and Factor and select Pop1 Level or Pop 2 Level.
-
-
Check the Paired Data checkbox.
-
In the Test of Hypothesis tab
-
Type in Significance Level.
-
Input the alternative hypothesis by selecting one of <, >, != and entering a value for the Alternative hypothesis.
-
-
In the Method section, check the Wilcoxon Signed-Rank and/or Sign Test checkboxes.
Note, various options for these tests are available in the Details dropdown on the top menu bar.
-
Click the preview icon
to see the result.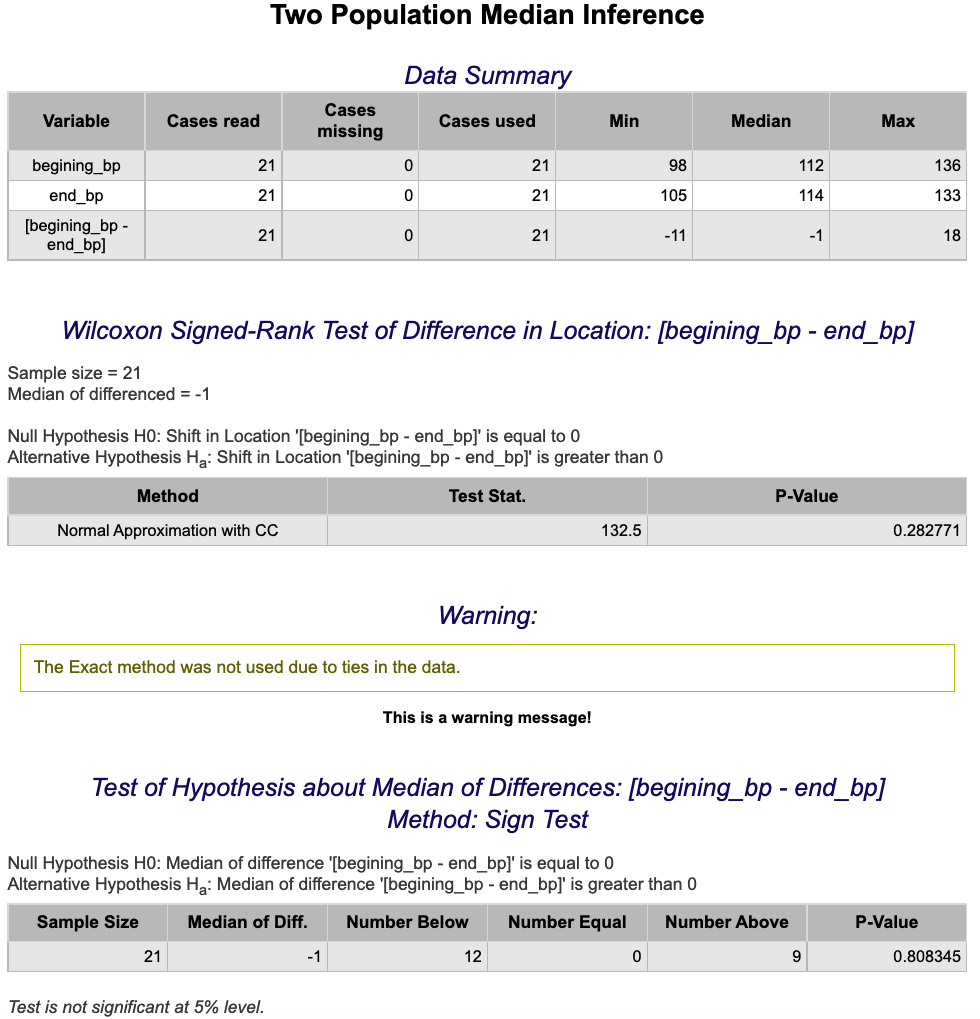
Normal Distribution
Inverse Normal
-
Open the Probability-Simulation toolbox on the left-hand side of the Rguroo window. Use the Probability dropdown menu, and choose the Probability Calculator option, and then select Continuous.
-
Select the option Probability ⇒ Values.
-
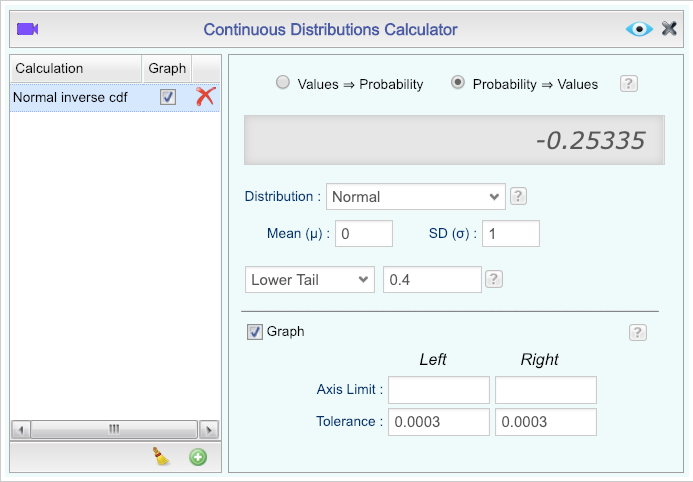
Select Normal as the Distribution and enter the Mean and Standard Deviation.
-
Select the option Lower Tail from the dropdown menu, then type the desired area in the text field.
-
Adjust the other options appropriately, including checking the Graph option and editing the Calculation Name, if desired.
-
Click the preview icon
to see the result.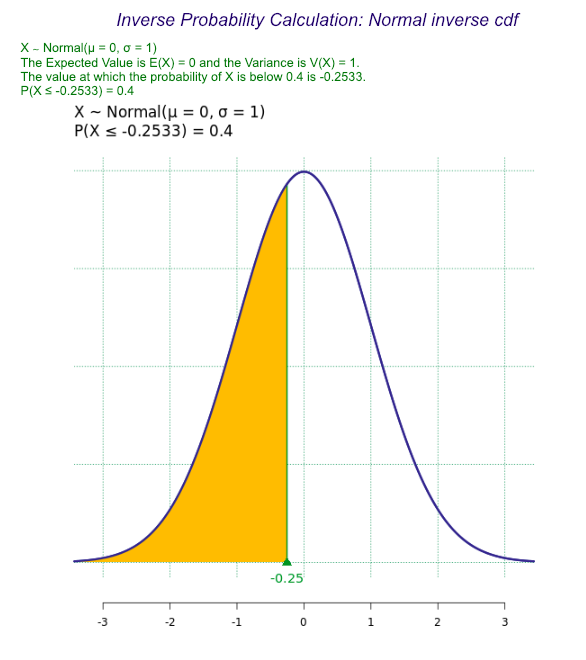
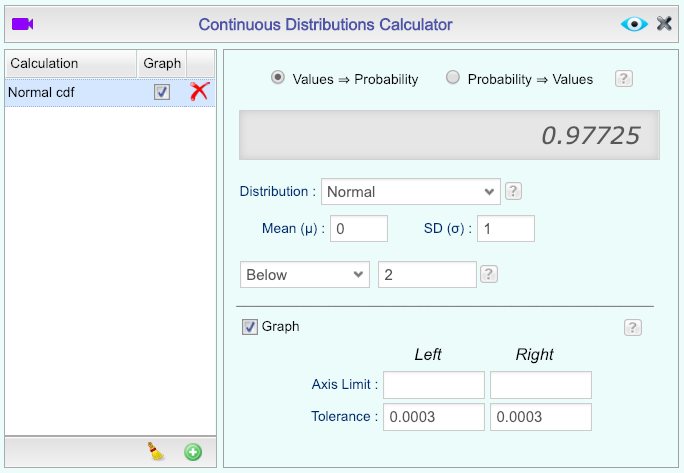
Normal Probability (cdf)
-
Open the Probability-Simulation toolbox on the left-hand side of the Rguroo window. Use the Probability dropdown menu, and choose the Probability Calculator option, and then select Continuous.
-
Select the option Values ⇒ Probability.
-
Select Normal as the Distribution, and enter the Mean and Standard Deviation.
-
Select the option Below from the dropdown menu, then type the desired value in the text field.
-
Adjust the other options appropriately, including checking the Graph option and editing the Calculation Name, if desired.
-
Click the preview icon
to see the result.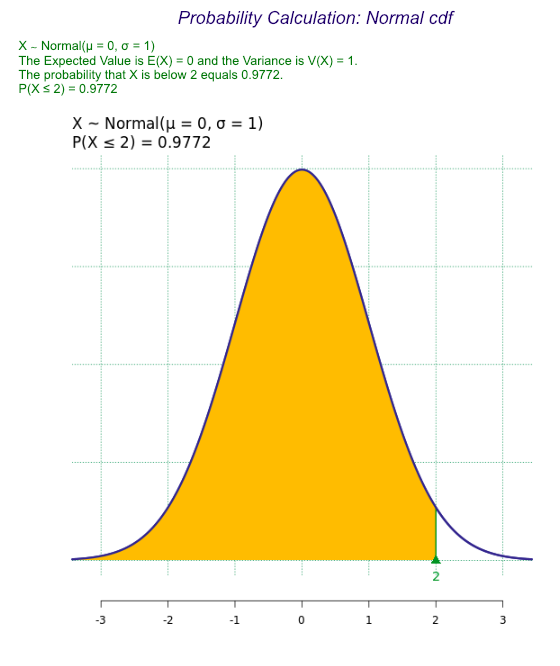
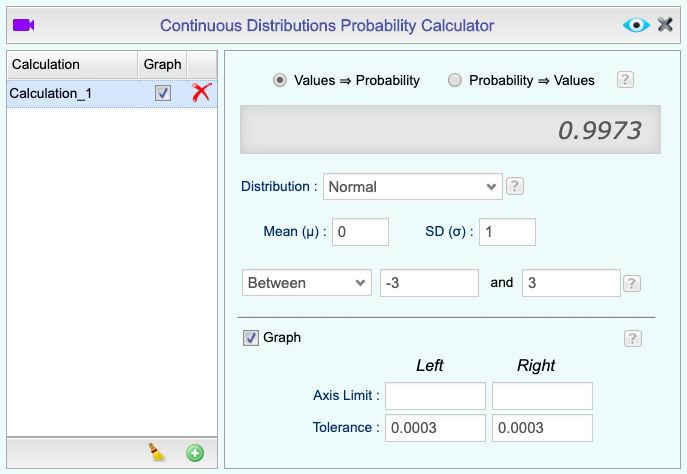
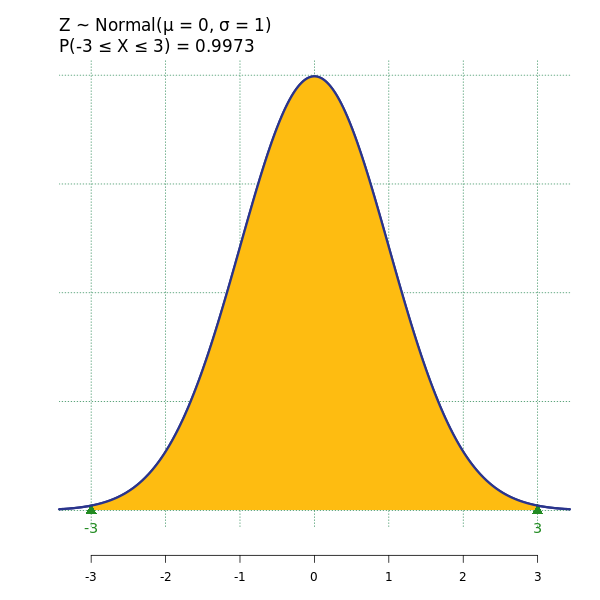
Normal Probability Graph
-
Open the Probability-Simulation toolbox on the left-hand side of the Rguroo window. Use the Probability dropdown menu, choose the Probability Calculator option, and then select Continuous.
-
Select the option Values ⇒ Probability.
-
Select Normal as the Distribution and enter the Mean and Standard Deviation.
-
Select the option Between from the dropdown menu, then type the desired lower tail and upper tail values in the text fields.
-
Adjust the other options appropriately, including checking the Graph option and editing the Calculation Name, if desired.
-
Click the preview icon
.
Test for Normality
-
See Creating a Dataset to input your data or recreate the example below by Accessing the Rguroo Data Repository and using the 'cardata' dataset found in the 'Rguroo Users Guide' repository.
-
Open the Analytics toolbox on the left-hand side of the Rguroo window. Use the Analysis dropdown menu, choose the Mean Inference option, and then select One Population.
-
Select a Dataset and select a Variable.
-
Check the Test for Normality checkbox.
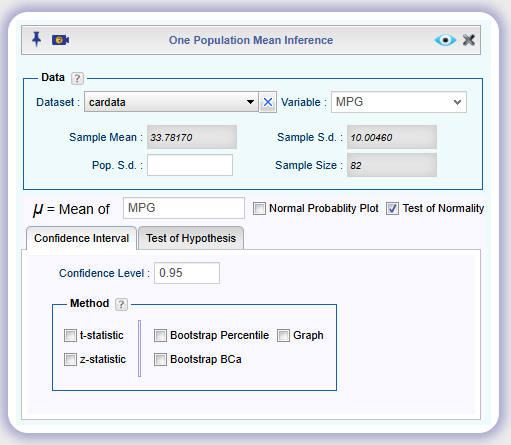
-
Click the preview icon
to see the result.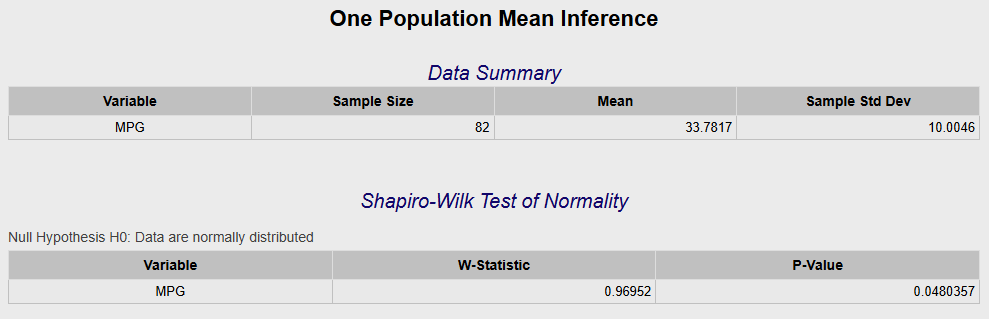
Poisson Distribution
Poisson Probability (cdf)
-
Open the Probability-Simulation toolbox on the left-hand side of the Rguroo window. Use the Probability dropdown menu, choose the Probability Calculator option, and then select Discrete.
-
Select the option Values ⇒ Probability.
-
Select Poisson as the Distribution and enter a Mean (lambda) value.
-
Select the option Below from the dropdown menu, then type the Number of Successes in the text field.
-
Adjust the other options appropriately, including checking the Graph option and editing the Calculation Name, if desired.
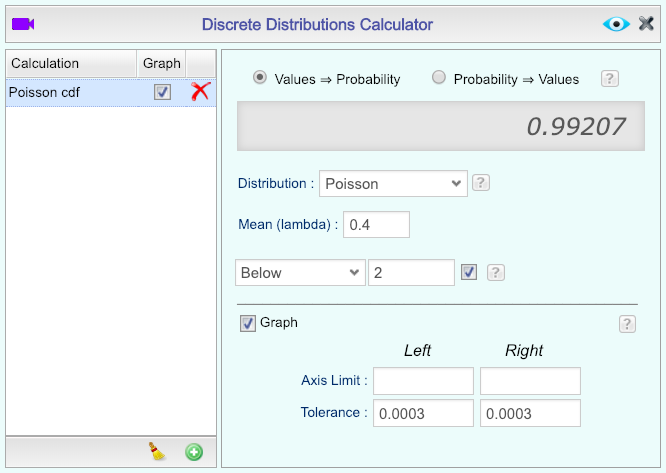
-
Click the preview icon
to see the result.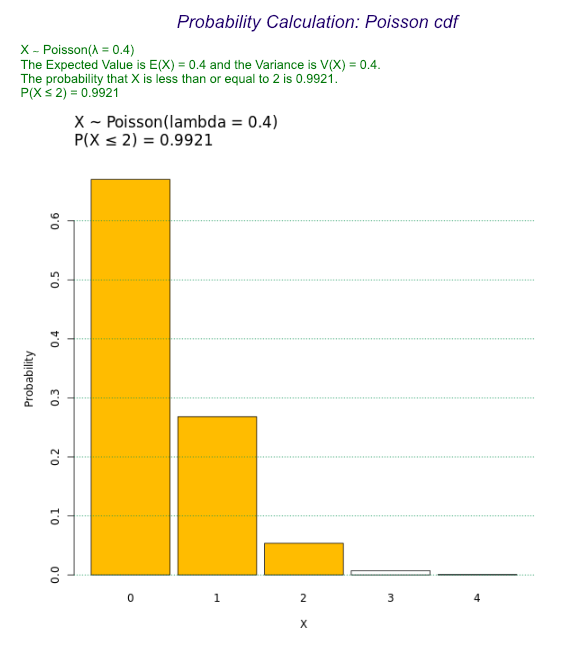
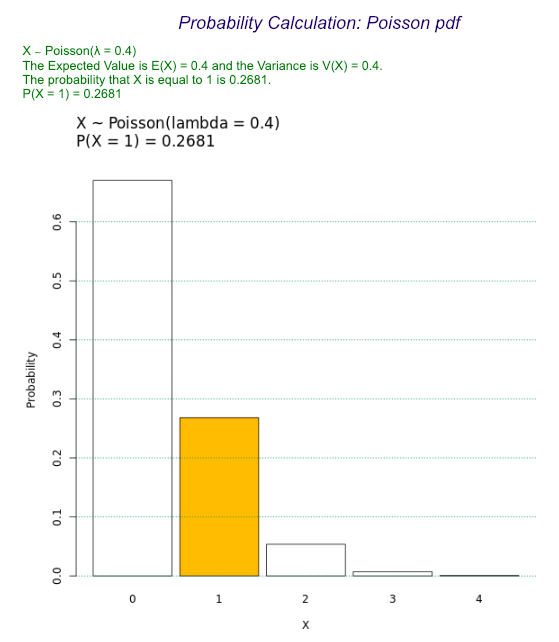
Poisson Probability (pdf)
-
Open the Probability-Simulation toolbox on the left-hand side of the Rguroo window. Use the Probability dropdown menu, choose the Probability Calculator option, and then select Discrete.
-
Select the option Values ⇒ Probability.
-
Select Poisson as the Distribution, and enter a Mean (lambda) value.
-
Select the option Equal from the dropdown menu, then type the Number of Successes in the text field.
-
Adjust the other options appropriately, including checking the Graph option and editing the Calculation Name, if desired.

-
Click the preview icon
.
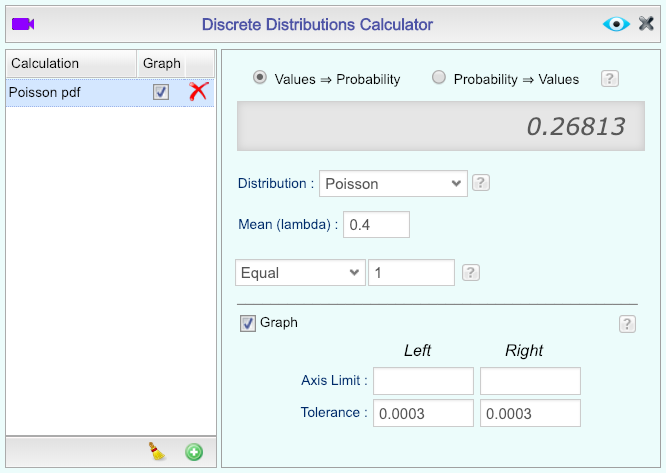
Poisson Probability Distribution
-
Open the Probability-Simulation toolbox on the left-hand side of the Rguroo window. Use the Probability dropdown menu, choose the Probability Calculator option, and then select Discrete.
-
Select the option Values ⇒ Probability.
-
Select Poisson as the Distribution and enter a mean value (lambda).
-
Select the option Equal from the dropdown menu. Then type the Number of Successes in the text field to the right.
-
Adjust the other options appropriately, including checking the Graph option and editing the Calculation Name, if desired.
-
Click the preview icon
.
Regression
Confidence Intervals for Slope and y-Intercept
-
See Creating a Dataset to input your data or recreate the example below by Accessing the Rguroo Data Repository and using the 'cereal' dataset found in the 'Rguroo Users Guide' repository.
-
Open the Analytics toolbox on the left-hand side of the Rguroo window. Use the Analysis dropdown menu, choose the Linear Regression option, and then select Simple & Multiple Regression.
-
-
Select a Dataset.
-
In the Model Specification section, select the Response variable from the dropdown menu.
-
In the Formula textbox, specify the model by either typing or double-clicking the name of the variables from the Variable list. Separate explanatory variables by the plus sign
 .
.
-
-
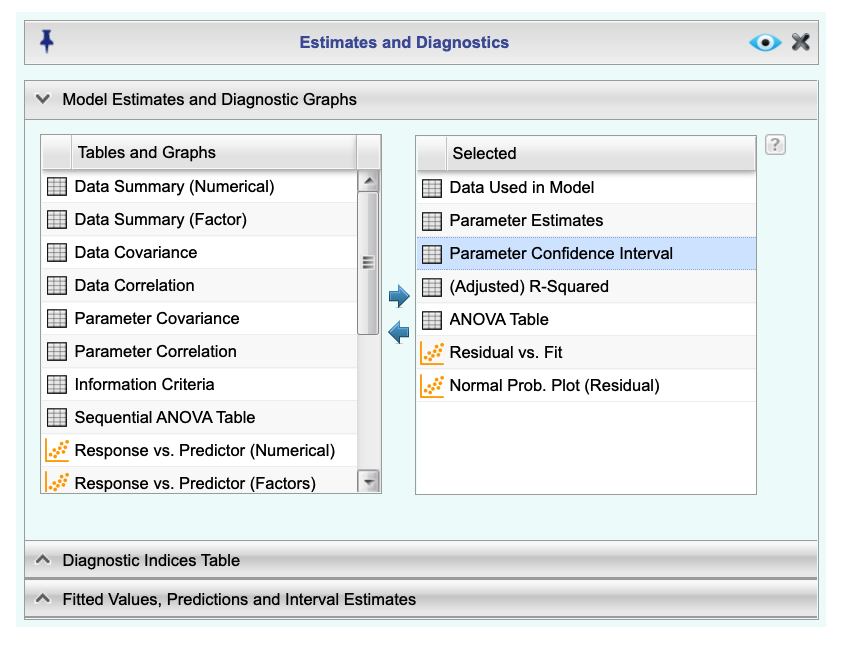
To obtain a confidence interval for the parameters, open the Details dropdown on the top menu bar.
-
Open the first section labeled Model Estimates and Diagnostics Graphs.
-
In the column labeled Table and Graphs select Parameter Confidence Interval by moving it to the Selected column. (Either use arrows or drag-and-drop).
-
Enter a Confidence level. The default value is 0.95 (95%).
-
-
Click the preview icon
to see the result.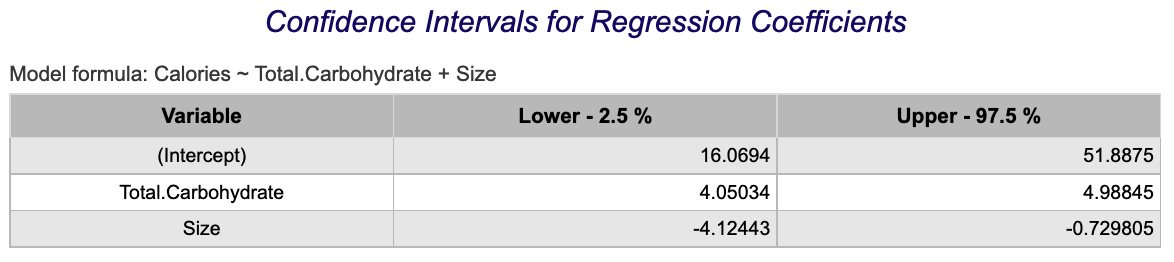
Correlation Coefficient
See Multiple Regression.
Coefficient of Determination
See Multiple Regression.
Hypothesis Testing for Slope Coefficient
-
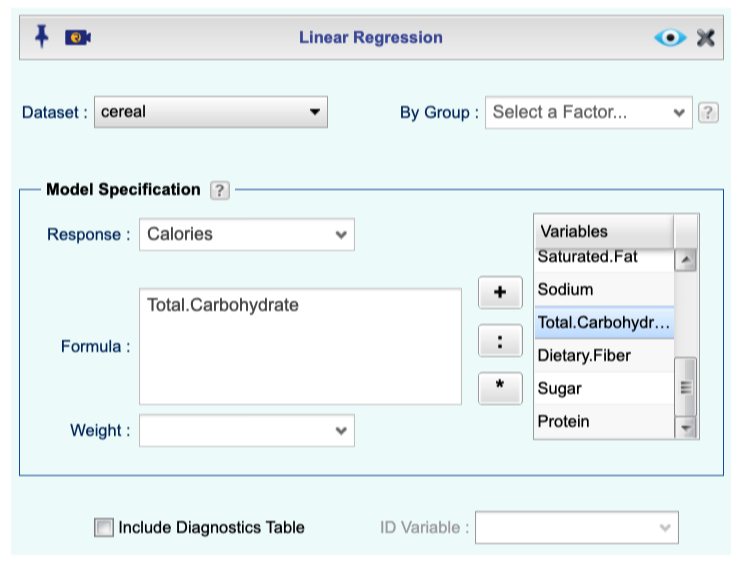
See Creating a Dataset to input your data or recreate the example below by Accessing the Rguroo Data Repository and using the 'cereal' dataset found in the 'Rguroo Users Guide' repository.
-
Open the Analytics toolbox on the left-hand side of the Rguroo window. Use the Analysis dropdown menu, choose the Linear Regression option, and then select Simple & Multiple Regression.
-
-
Select a Dataset.
-
In the Model Specification section, select the Response variable from the dropdown menu.
-
In the Formula textbox, specify the explanatory variable. This can be done by either typing or double-clicking the name of the variable from the Variable list.
-
-
Click the preview icon
to see the result. You will see the component of test of hypothesis for parameters under the section Regression Coefficients Estimates and t-Test.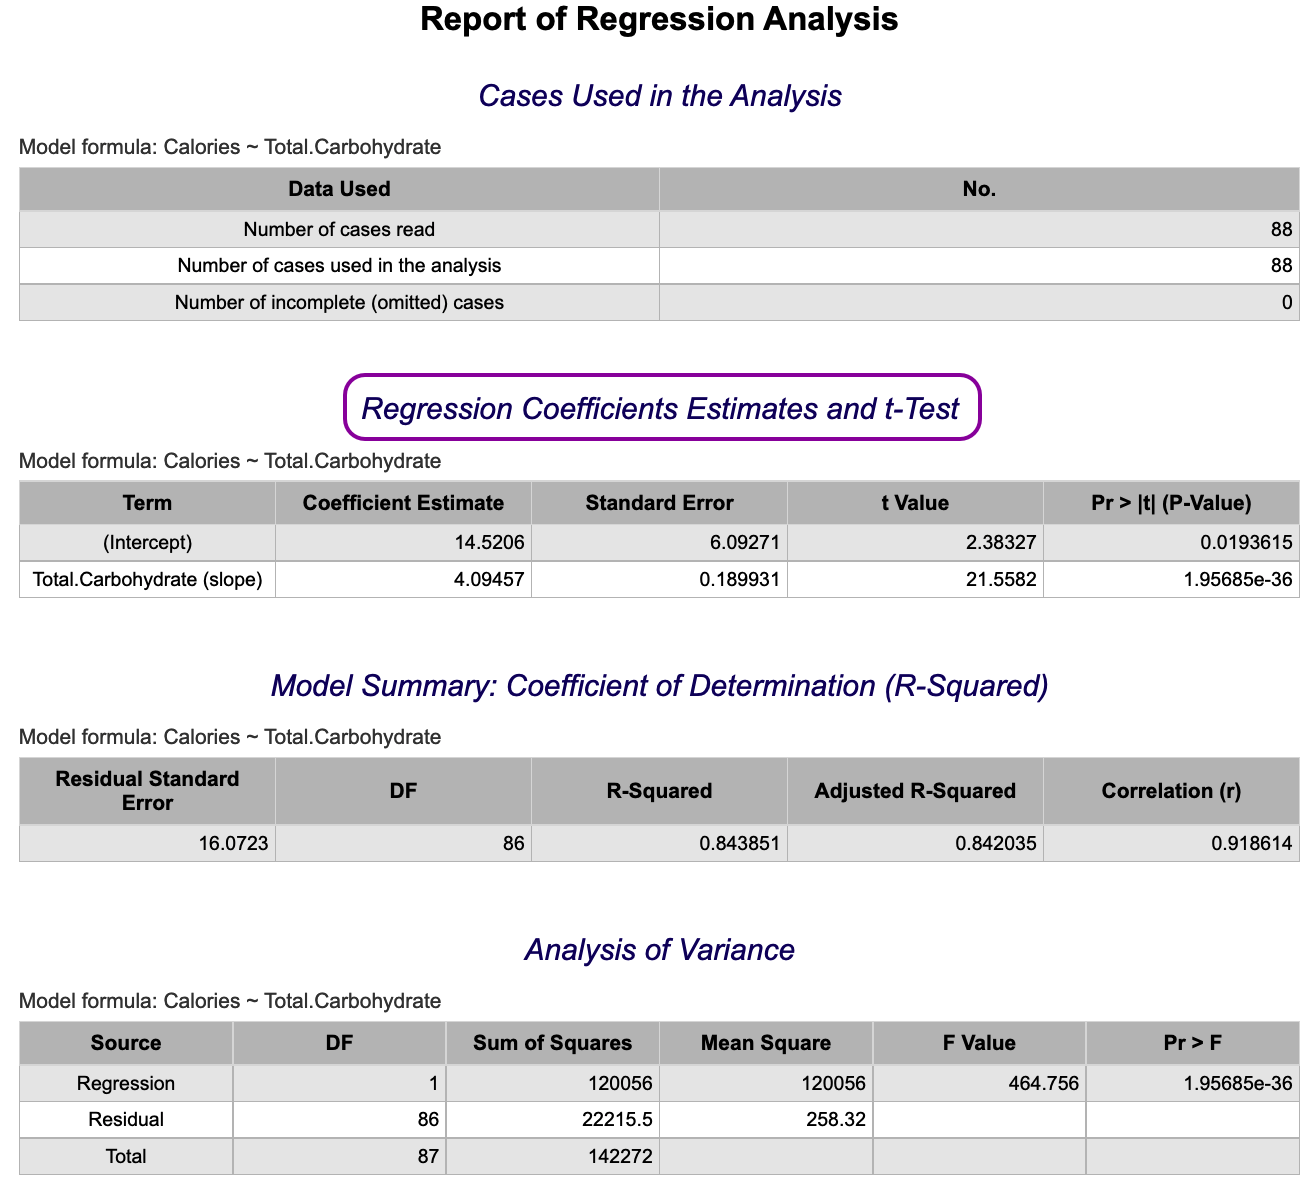
Linear Regression Fitted Line Plot with Confidence Interval
-
See Creating a Dataset to input your data or recreate the example below by Accessing the Rguroo Data Repository and using the 'cereal' dataset found in the 'Rguroo Users Guide' repository.
-
Open the Analytics toolbox on the left-hand side of the Rguroo window. Use the Analysis dropdown menu, choose the Linear Regression option, and then select Simple & Multiple Regression.
-
-
Select a Dataset.
-
In the Model Specification section, select the Response variable from the dropdown menu.
-
In the Formula textbox, specify the model by either typing or double-clicking the name of the variables from the Variable list. Separate explanatory variables by the plus sign
.
-
-
To obtain a confidence interval for the mean of y given x, open the Details dropdown on the top menu bar.
-
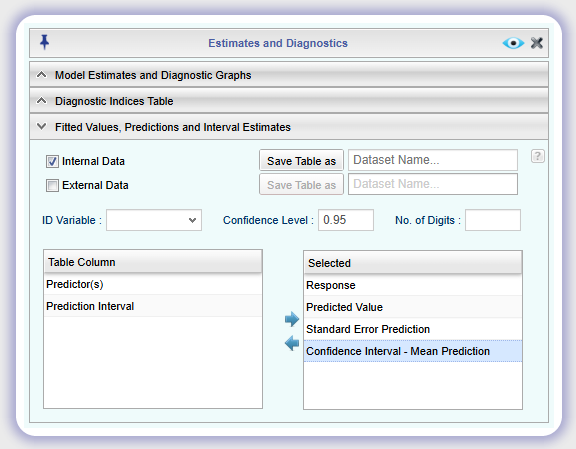
Open the section labeled Fitted Values, Predictions, and Interval Estimates.
-
Check the Internal Data checkbox.
-
Enter a Confidence level. The default value is 0.95 (95%).
-
Move Confidence Interval – Mean Prediction to the Selected column by double-clicking or dragging and dropping.
-
-
Click the preview icon
to see the result.
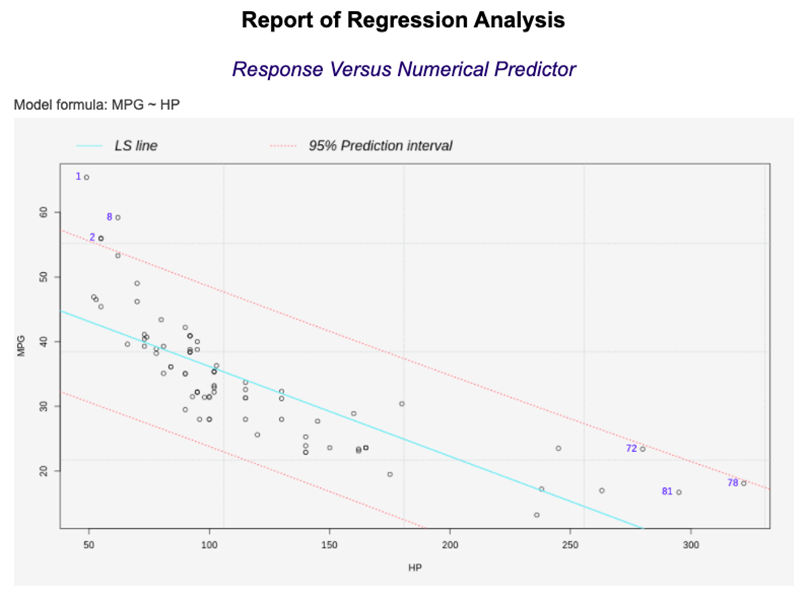
Linear Regression Fitted Line with Prediction Interval
-
See Creating a Dataset to input your data or recreate the example below by Accessing the Rguroo Data Repository and using the 'cardata' dataset found in the 'Rguroo Users Guide' repository.
-
Open the Analytics toolbox on the left-hand side of the Rguroo window. Use the Analysis dropdown menu. choose the Linear Regression option, and then select Simple & Multiple Regression.
-
-
Select a Dataset.
-
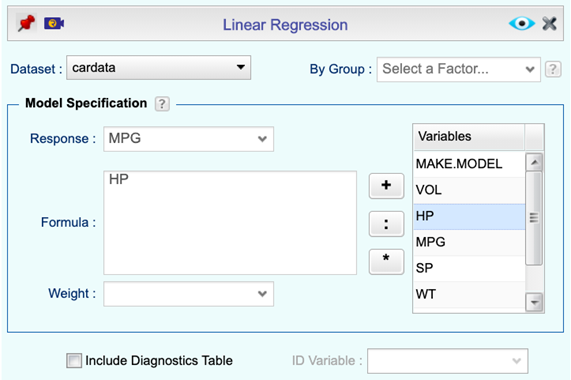
In the Model Specification section, select the Response variable from the dropdown menu.
-
In the Formula textbox, enter a formula using the variables and
,  , and
, and  buttons. Here we regress MPG by HP (Horsepower).
-
-
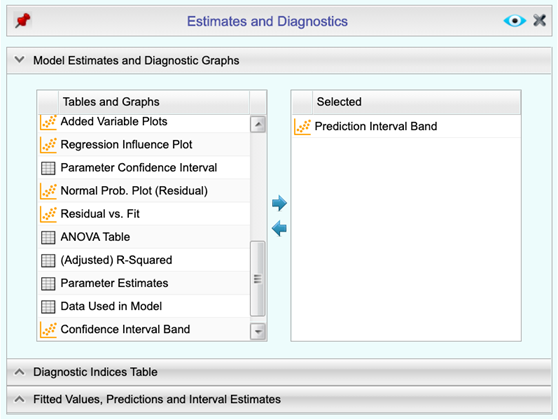
To add additional output to the report, open the Details dropdown on the top menu bar.
-
Open the section labeled Model Estimates and Diagnostics Graphs.
-
Drag-and-drop, double-click, or use the arrows to move Prediction Interval Band to the right-hand box labeled Selected.
Add or remove the desired Tables and Graphs in the Selected column.
-
Optionally, enter a Confidence level. The default value is 0.95 (95%).
-
-
Click the preview icon
.
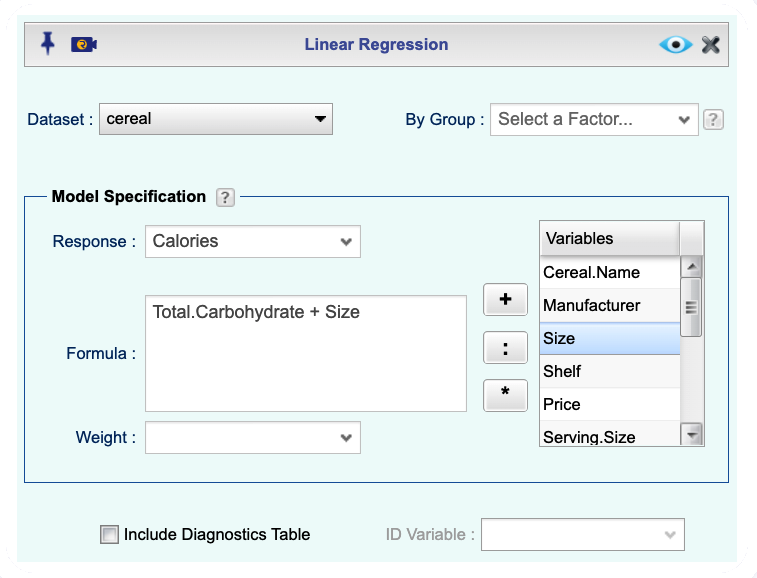
Multiple Regression
-
See Creating a Dataset to input your data or recreate the example below by Accessing the Rguroo Data Repository and using the 'cereal' dataset found in the 'Rguroo Users Guide' repository.
-
Open the Analytics toolbox on the left-hand side of the Rguroo window. Use the Analysis dropdown menu, choose the Linear Regression option, and then select Simple & Multiple Regression.
-
-
Select a Dataset.
-
In the Model Specification section, select the Response variable from the dropdown menu.
-
In the Formula textbox, specify the model by either typing or double-clicking the name of the variables from the Variable list. Separate explanatory variables by the plus sign
.
-
-
Click the preview icon
to see the result.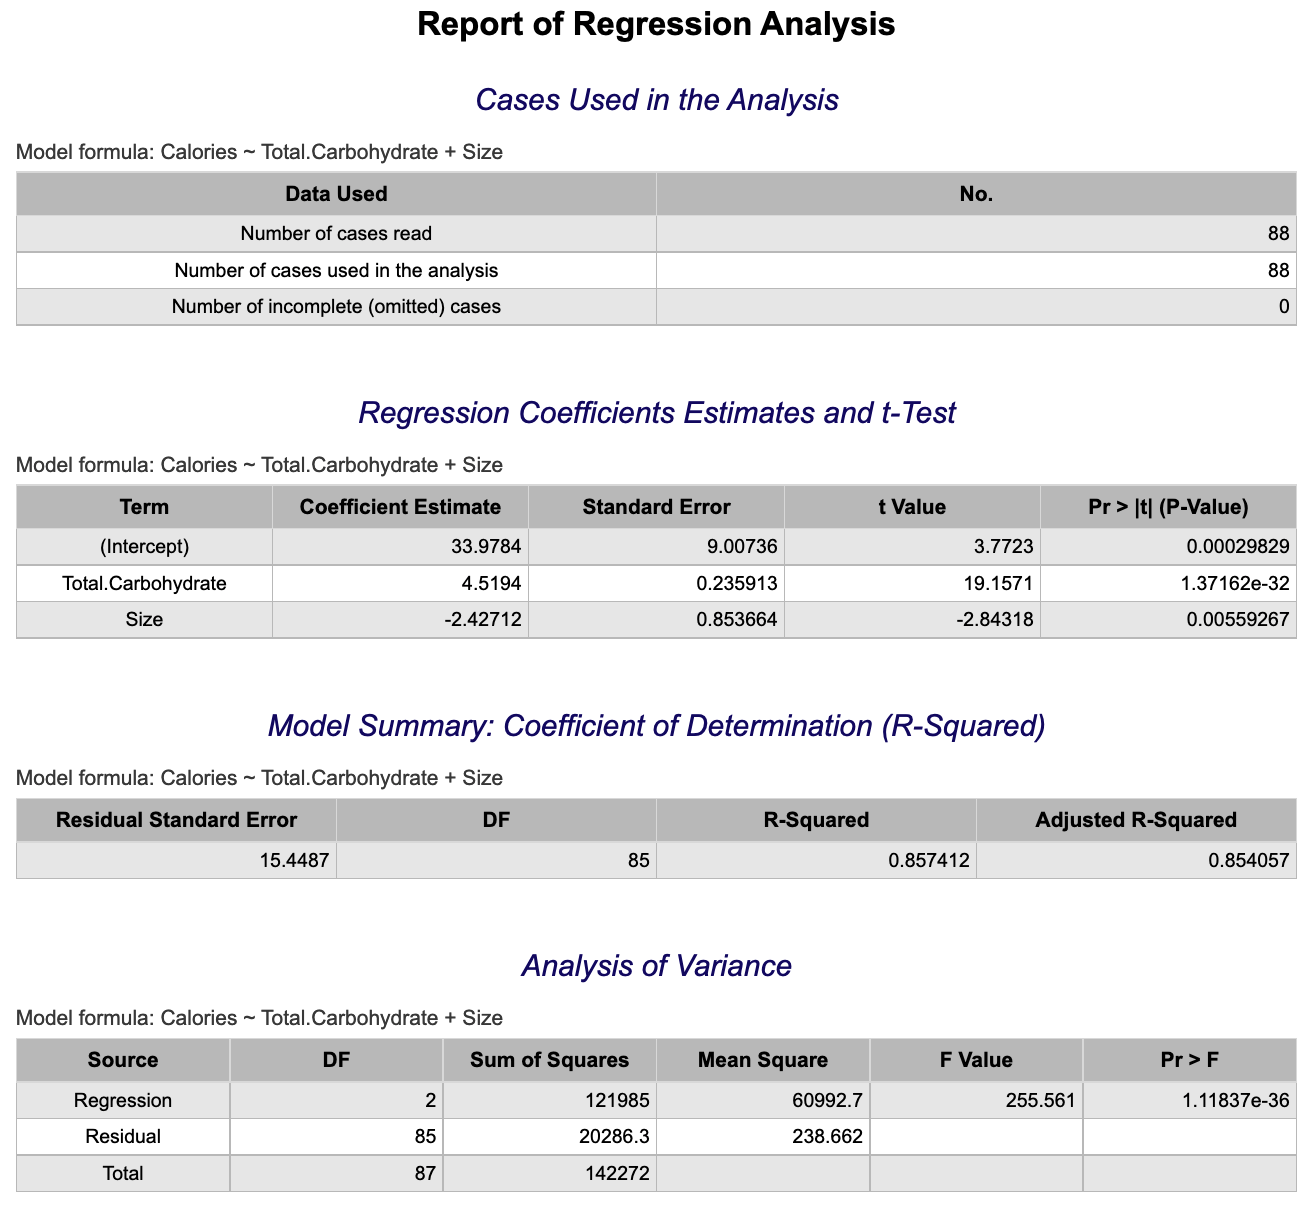
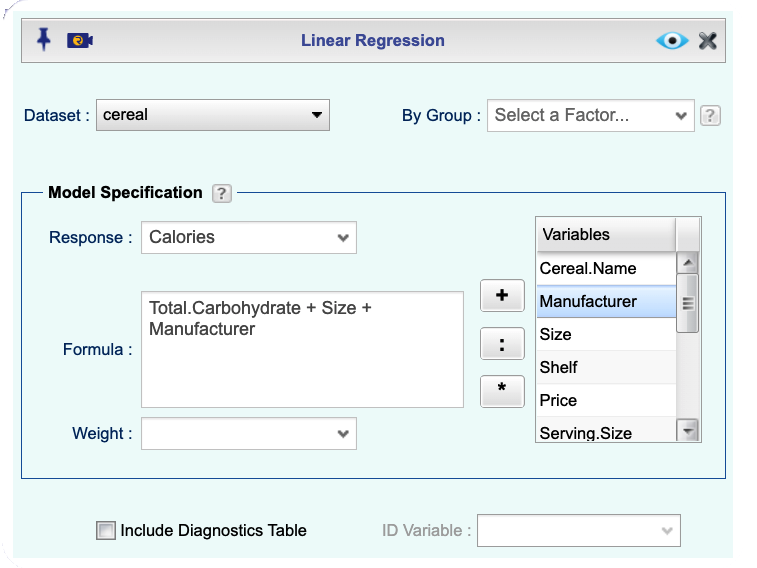
Multiple Regression Models with Qualitative Independent Variables
-
See Creating a Dataset to input your data or recreate the example below by Accessing the Rguroo Data Repository and using the 'cereal' dataset found in the 'Rguroo Users Guide' repository.
-
Open the Analytics toolbox on the left-hand side of the Rguroo window. Use the Analysis dropdown menu, choose the Linear Regression option, and then select Simple & Multiple Regression.
-
-
Select a Dataset.
-
In the Model Specification section, select the Response variable from the dropdown menu.
-
In the Formula textbox, specify the model by either typing or double-clicking the name of the variables from the Variable list. The explanatory variables can be either quantitative or qualitative. Separate explanatory variables by the plus sign
.
-
-
Click the preview icon
to see the result.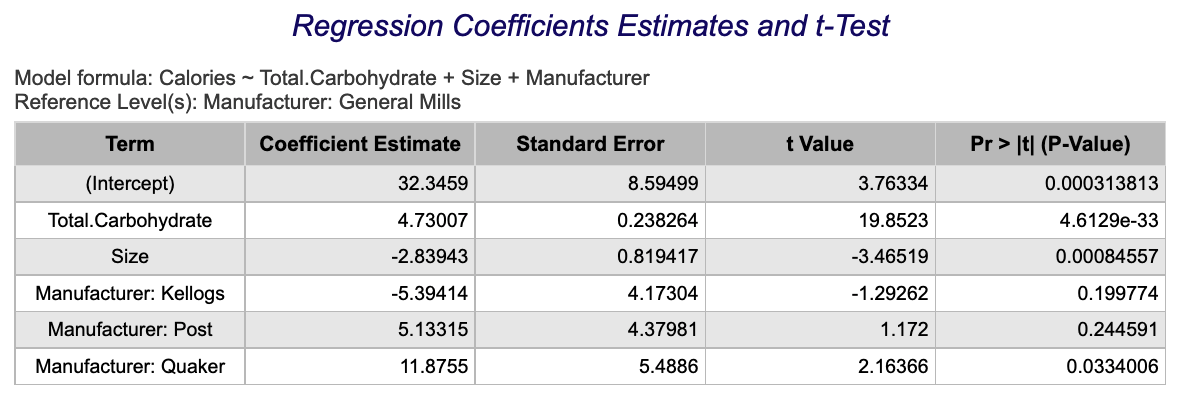
Regression Prediction Intervals
-
See Creating a Dataset to input your data or recreate the example below by Accessing the Rguroo Data Repository and using the 'cereal' dataset found in the 'Rguroo Users Guide' repository.
-
Open the Analytics toolbox on the left-hand side of the Rguroo window. Use the Analysis dropdown menu, choose the Linear Regression option, and then select Simple & Multiple Regression.
-
-
Select a Dataset.
-
In the Model Specification section, select the Response variable from the dropdown menu.
-
In the Formula textbox, specify the model by either typing or double-clicking the name of the variables from the Variable list. Separate explanatory variables by the plus sign
.
-
-
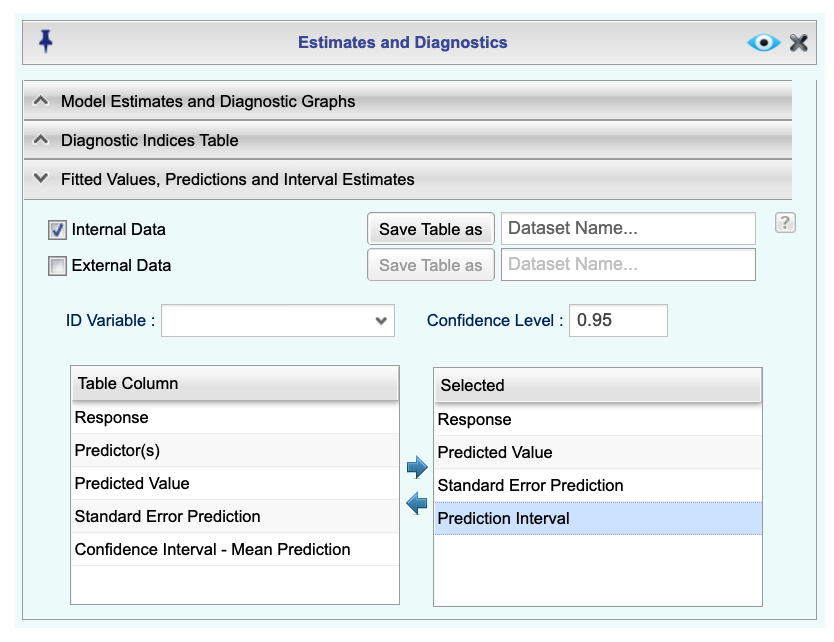
To obtain a confidence interval for the prediction of y given x, open the Details dropdown on the top menu bar.
-
Open the section labeled Fitted Values, Predictions, and Interval Estimates.
-
Check the Internal Data checkbox.
Note, data that are not used in fitting the model are called External Data. You can add external data to your dataset by setting the corresponding value of the response for each case to 'NA'.
-
Enter a Confidence level. The default value is 0.95 (95%).
-
Move Prediction Interval to the Selected column by double-clicking or dragging and dropping.
-
-
Click the preview icon
to see the result.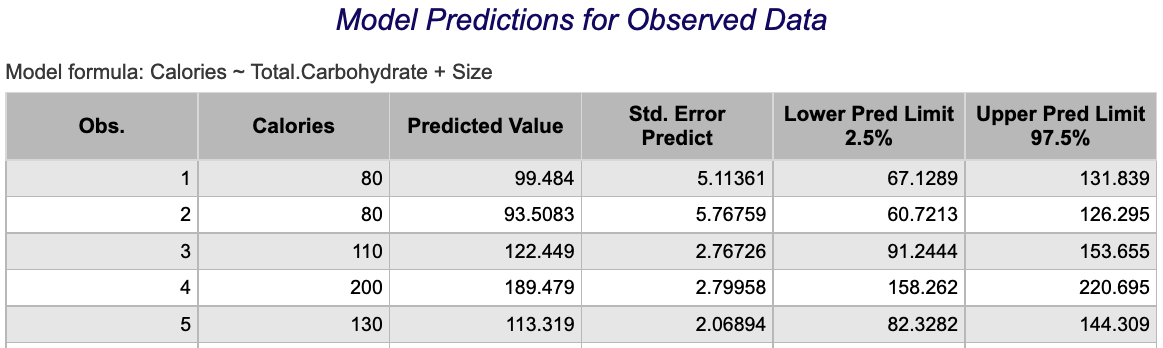
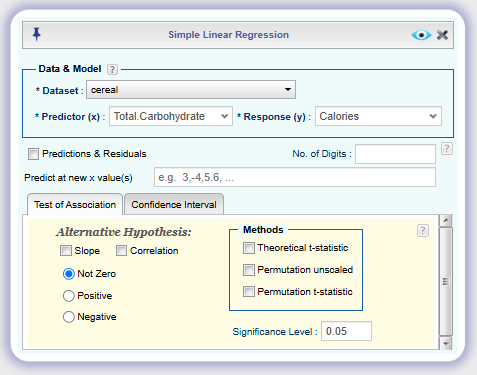
Simple Linear Regression
-
See Creating a Dataset to input your data or recreate the example below by Accessing the Rguroo Data Repository and using the 'cereal' dataset found in the 'Rguroo Users Guide' repository.
-
Open the Analytics toolbox on the left-hand side of the Rguroo window. Use the Analysis dropdown menu, choose the Linear Regression option, and then select Simple Regression.
-
-
Select a Dataset.
-
From the Predictor (x) and Response (y) dropdown menus, select the predictor and response variables.
-
-
Click the preview icon
to see the result.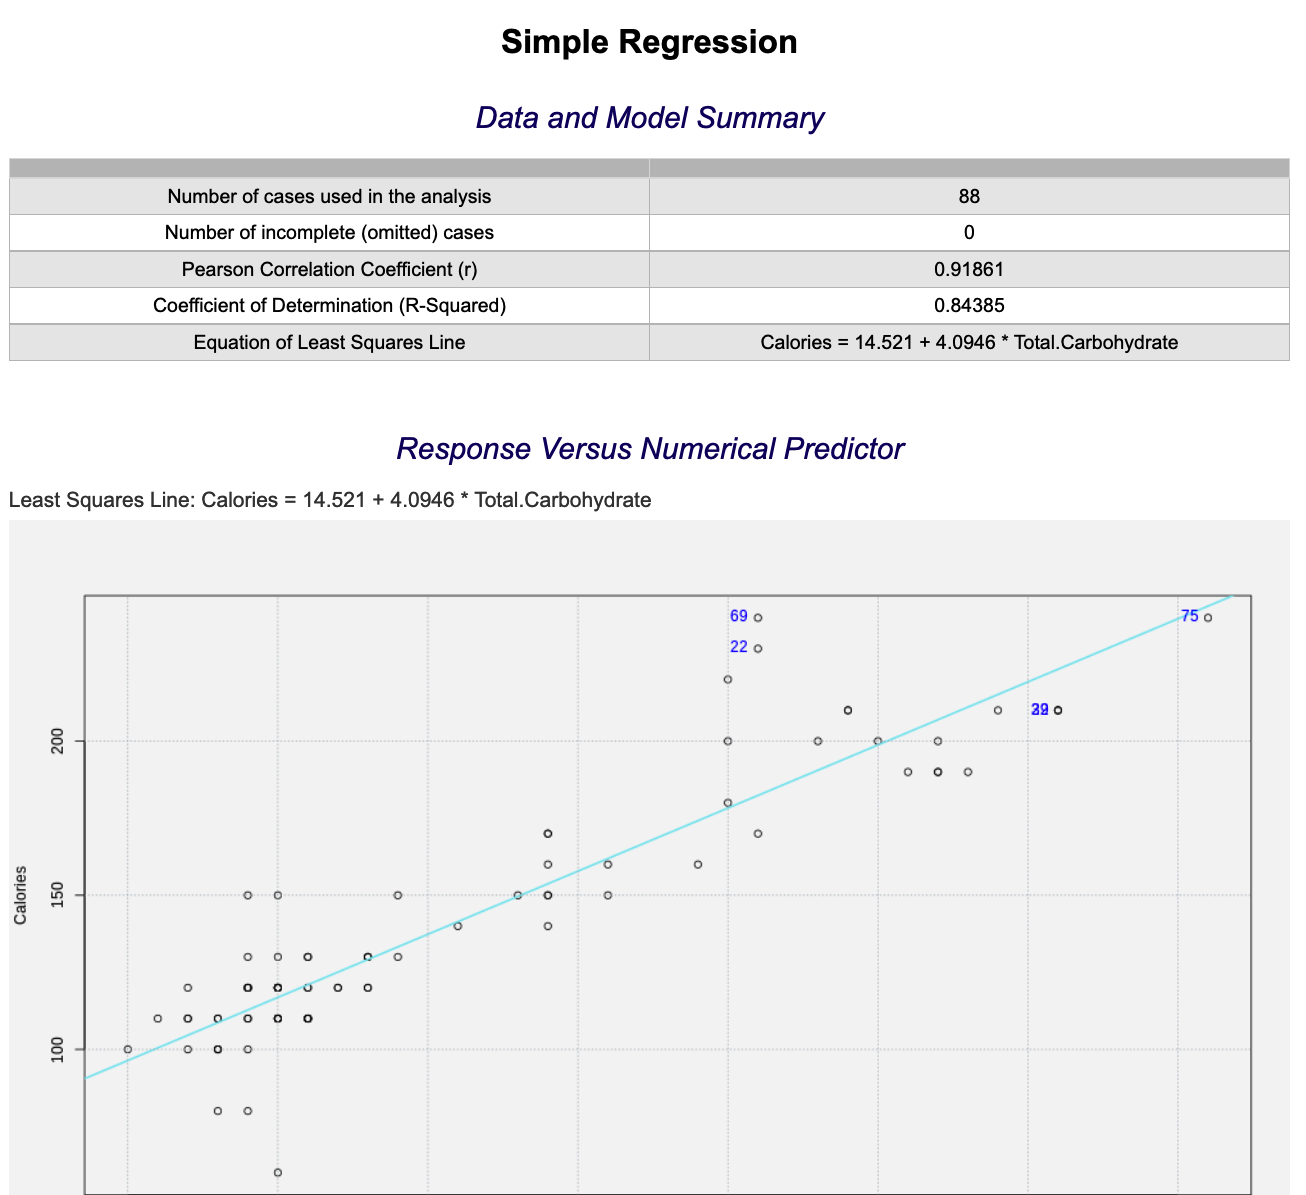
Sampling
Random Samples
-
Open the Probability-Simulation toolbox on the left-hand side of the Rguroo window. Use the Probability dropdown menu and choose Random Generator.
-
Select Uniform as the Distribution and enter Min (a), Max (b), and Sample Size.
-
Adjust the other options appropriately, including setting the Seed to allow for Replications, if desired.
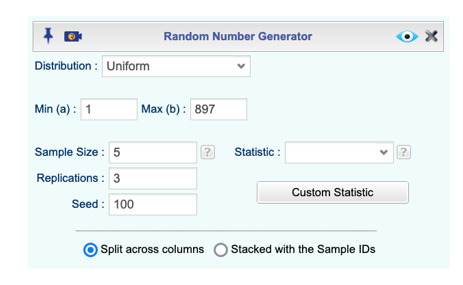
-
Click the preview icon
to see the result.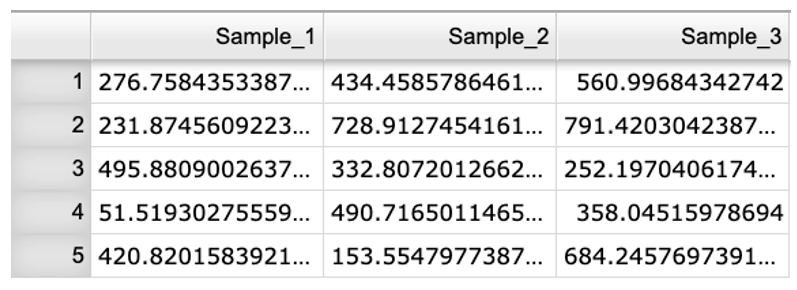
t-Distribution
Inverse t
-
Open the Probability-Simulation toolbox on the left-hand side of the Rguroo window. Use the Probability dropdown menu, choose the Probability Calculator option, and then select Continuous.
-
Select Student t as the Distribution, and enter the Degrees of Freedom.
-
Select the option Probability => Values.
-
Select the option Lower Tail from the dropdown menu, then type the desired Area in the text field.
-
Adjust the other options appropriately, including checking the Graph option and editing the Calculation Name, if desired.
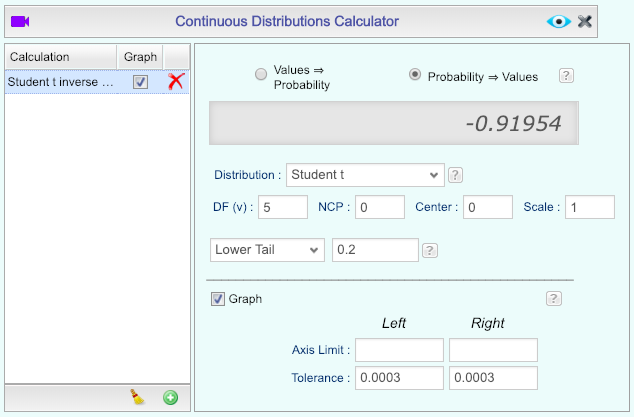
-
Click the preview icon
.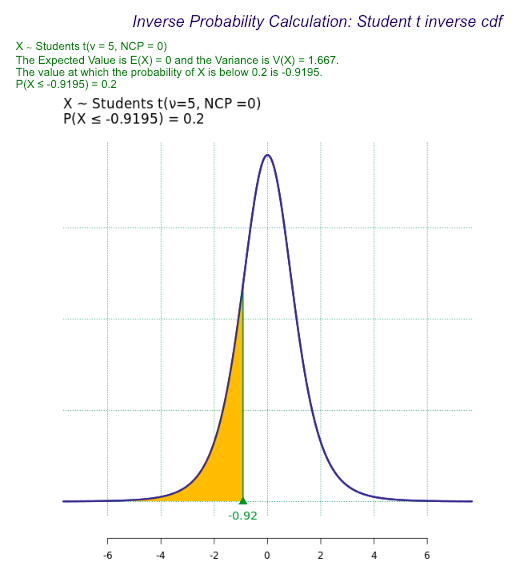
t-Probability (cdf)
-
Open the Probability-Simulation toolbox on the left-hand side of the Rguroo window. Use the Probability dropdown menu, choose the Probability Calculator option, and then select Continuous.
-
Select the option Values ⇒ Probability.
-
Select Student t as the Distribution, and enter the Degrees of Freedom DF(v). Leave the other parameters at the default values.
-
Select the option Below from the dropdown menu, then type the desired value in the text field.
-
Adjust the other options appropriately, including checking the Graph option and editing the Calculation Name, if desired.
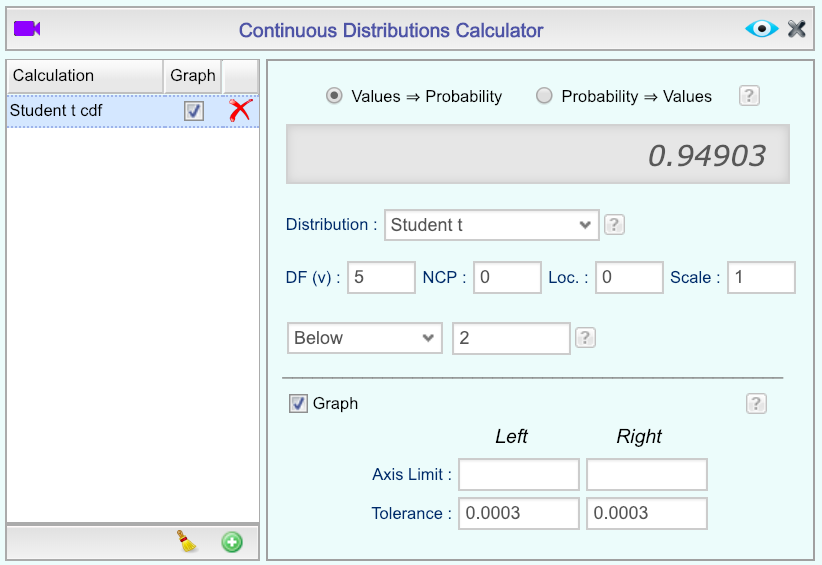
-
Click the preview icon
to see the result.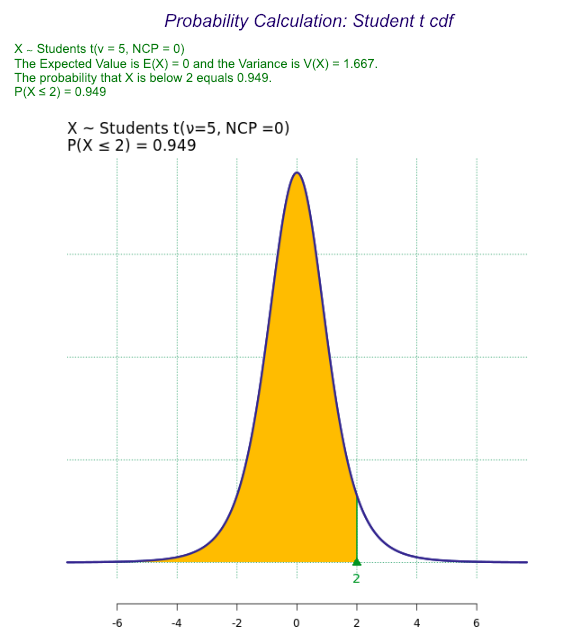
Time Series
Additive and Multiplicative Seasonal Smoothing (The Holt-Winters Method)
-
See Creating a Dataset to input your data or recreate the example below by Accessing the Rguroo Data Repository and using the 'AirPassengers' dataset found in the 'R datasets' repository.
-
Open the Analytics toolbox on the left-hand side of the Rguroo window. Use the Analysis dropdown menu and choose the Time Series option.
-
-
Select a dataset from the Dataset dropdown menu.
-
Under Numerical Variables, drag-and-drop a variable into the Selected column.
-
Under Time Specification, in the text field next to Freq., enter an integer value greater than or equal to 2 representing the number of observations per unit time (4 for quarterly data, 12 for monthly data, etc.).
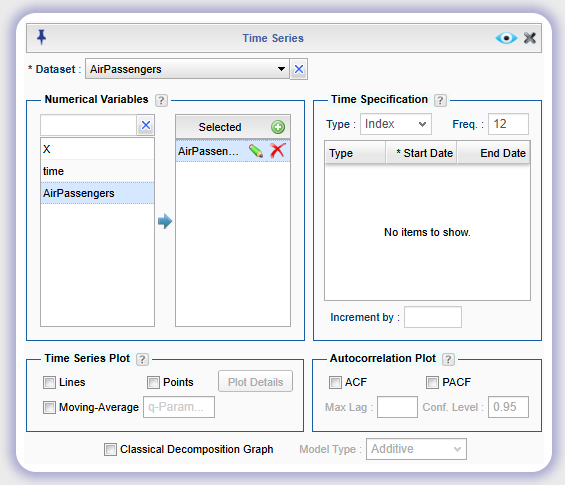
-
-
Click the Modeling dropdown on the top menu bar.

-
In the Methods and Forecasting tab under Method, check both Holt-Winters' and Graph.
-
In the text fields to the right of Holt-Winters', optionally enter an Alpha, Beta, and/or Gamma value between 0 and 1. If a value is not specified, a default value will be chosen by Rguroo.
-
In the dropdown menu labeled Holt-Winters' Model Type select "Additive" or "Multiplicative" for the type of seasonal smoothing.
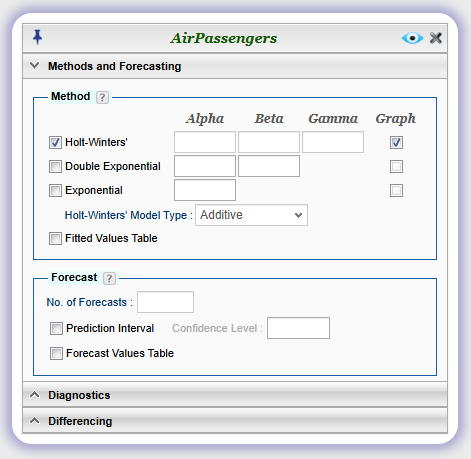
-
-
Click the preview icon
.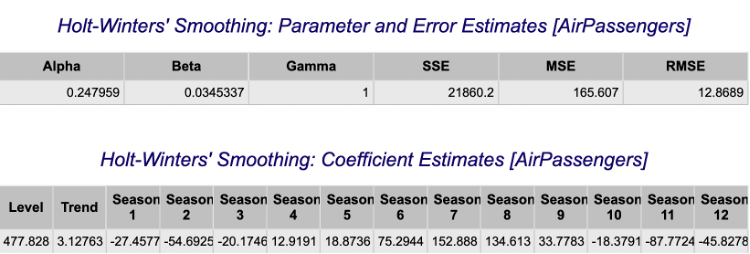
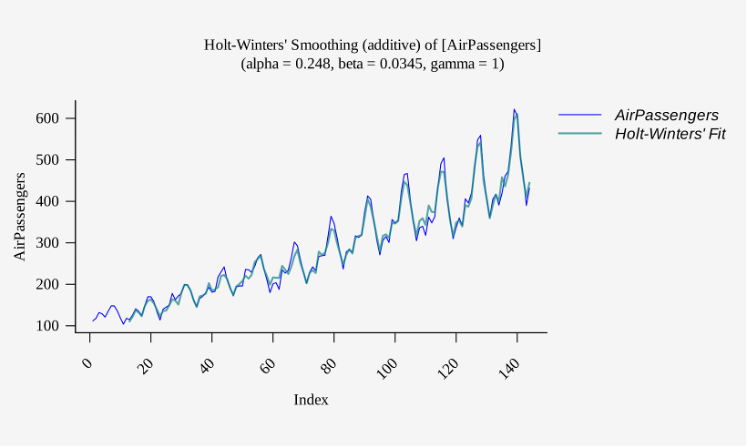
Adjusted Exponential Smoothing
-
See Creating a Dataset to input your data or recreate the example below by Accessing the Rguroo Data Repository and using the 'USAccDeaths' dataset found in the 'R datasets' repository.
-
Open the Analytics toolbox on the left-hand side of the Rguroo window. Use the Analysis dropdown menu and choose the Time Series option.
-
-
Select a dataset from the Dataset dropdown menu.
-
Under Numerical Variables, drag-and-drop a variable into the Selected column.
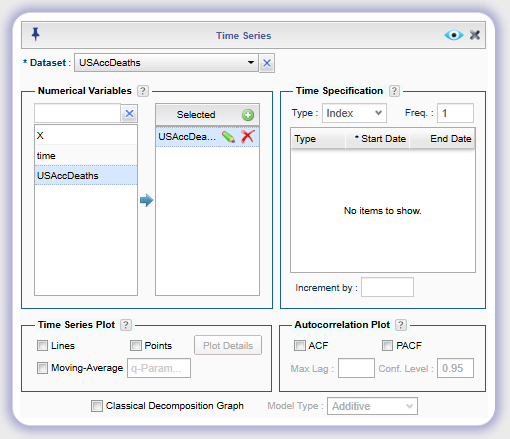
-
-
Click the Modeling dropdown on the top menu bar.
-
In the Methods and Forecasting tab under Method, check both Double Exponential and Graph.
-
In the text fields to the right of Double Exponential, optionally enter an Alpha and/or Beta value between 0 and 1. If a value is not specified, a default value will be chosen by Rguroo.
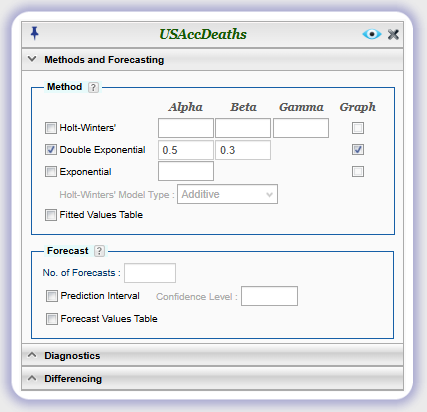
-
-
Click the preview icon
.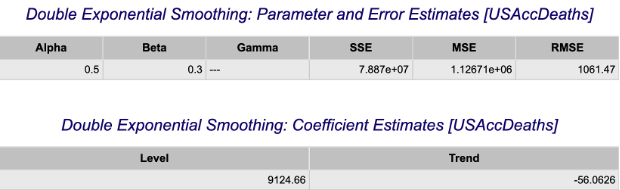
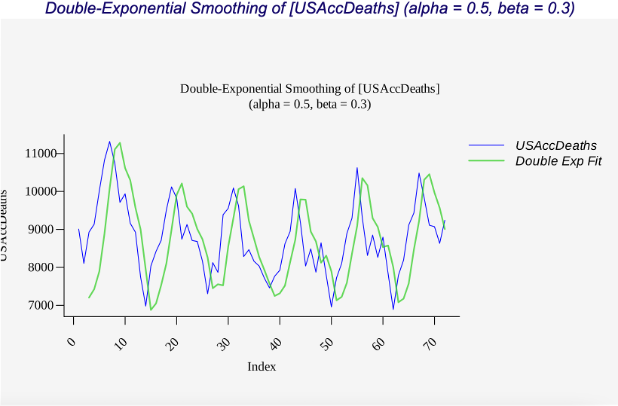
Forecasting Errors
-
See Creating a Dataset to input your data or recreate the example below by Accessing the Rguroo Data Repository and using the 'USAccDeaths' dataset found in the 'R datasets' repository. A portion of the data is shown below.
-
Open the Analytics toolbox on the left-hand side of the Rguroo window. Use the Analysis dropdown menu and choose the Time Series option.
-
-
Select a dataset from the Dataset dropdown menu.
-
Under Numerical Variables, drag-and-drop a variable into the Selected column.
-
-
Click the Modeling dropdown on the top menu bar.
-
In the Methods and Forecasting tab under Method, check the modeling method(s) you would like to use (Exponential, Double Exponential, and/or Holt-Winters).
-
Alpha, Beta, and Gamma parameters may be optionally specified in the text fields.
-
Check Fitted Values Table checkbox.
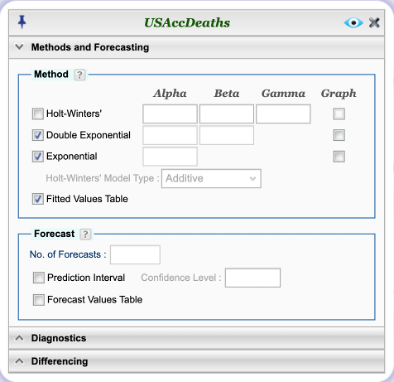
-
-
Click the preview icon
. The fitted values along with the forecasting errors (residuals) for each method selected are shown in the outputted table labeled 'Fitted Values and Residuals for Model Fit'.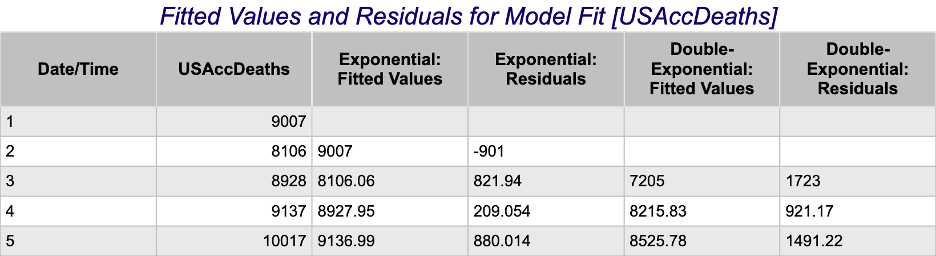
Moving Average Plot
-
See Creating a Dataset to input your data or recreate the example below by Accessing the Rguroo Data Repository and using the 'AirPassengers' dataset found in the 'R datasets' repository.
-
Open the Analytics toolbox on the left-hand side of the Rguroo window. Use the Analysis dropdown menu and choose the Time Series option.
-
-
Select a dataset from the Dataset dropdown menu.
-
Under Numerical Variables, drag-and-drop a variable into the Selected column.
-
In the bottom left under Time Series Plot, check both Lines and Moving Average.
-
In the text field to the right of Moving-Average labeled q-Param, enter an integer value equal to the desired number of periods to calculate the moving average over.
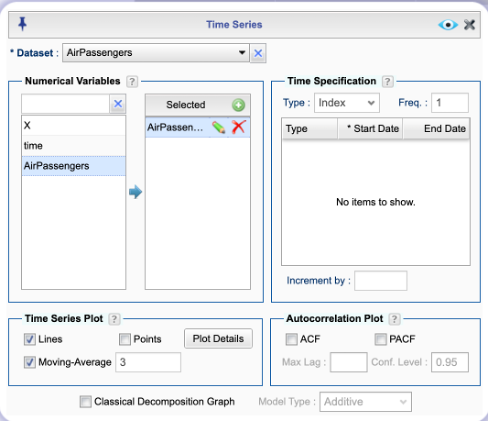
-
-
Click the preview icon
.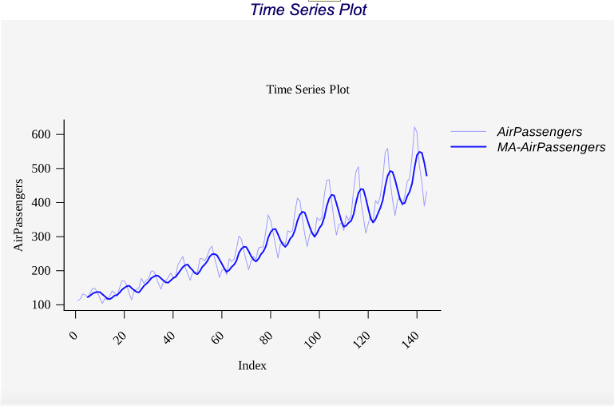
Simple Exponential Smoothing
-
See Creating a Dataset to input your data or recreate the example below by Accessing the Rguroo Data Repository and using the 'USAccDeaths' dataset found in the 'R datasets' repository. A portion of the data is shown below.
-
Open the Analytics toolbox on the left-hand side of the Rguroo window. Use the Analysis dropdown menu and choose the Time Series option.
-
-
Select a dataset from the Dataset dropdown menu.
-
Under Numerical Variables, drag-and-drop a variable into the Selected column.
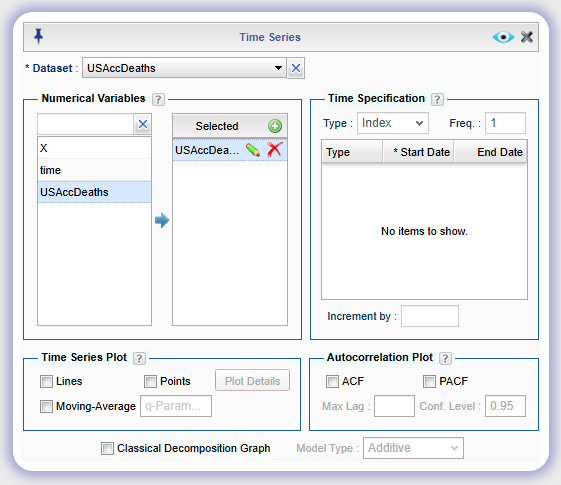
-
-
Click the Modeling dropdown on the top menu bar.
In the Methods and Forecasting tab under Method, check Exponential and Graph.
In the text field to the right of Exponential, optionally enter an Alpha value between 0 and 1. If a value is not specified, a default value will be chosen by Rguroo.
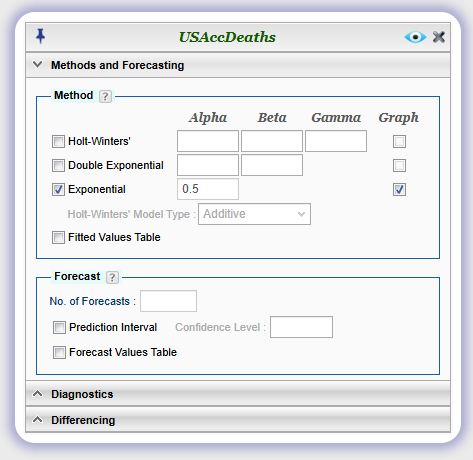
-
Click the preview icon
.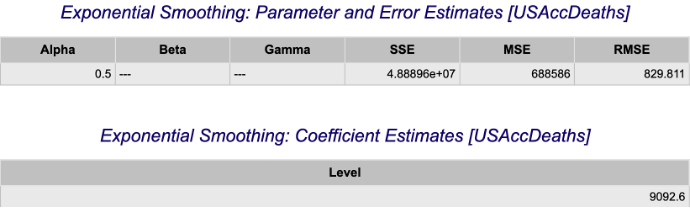
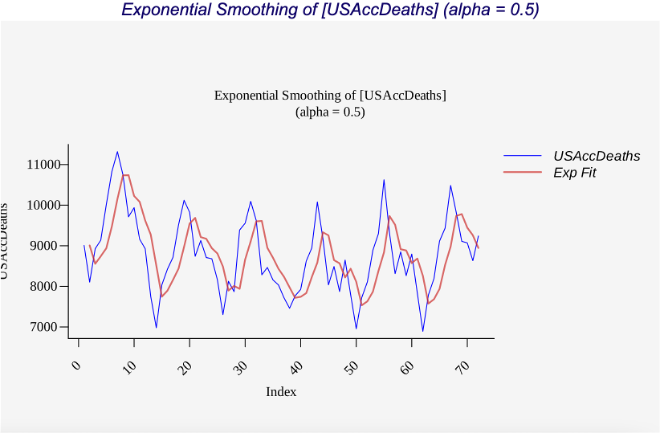
Simple Moving Average
- See Moving Average Plot.